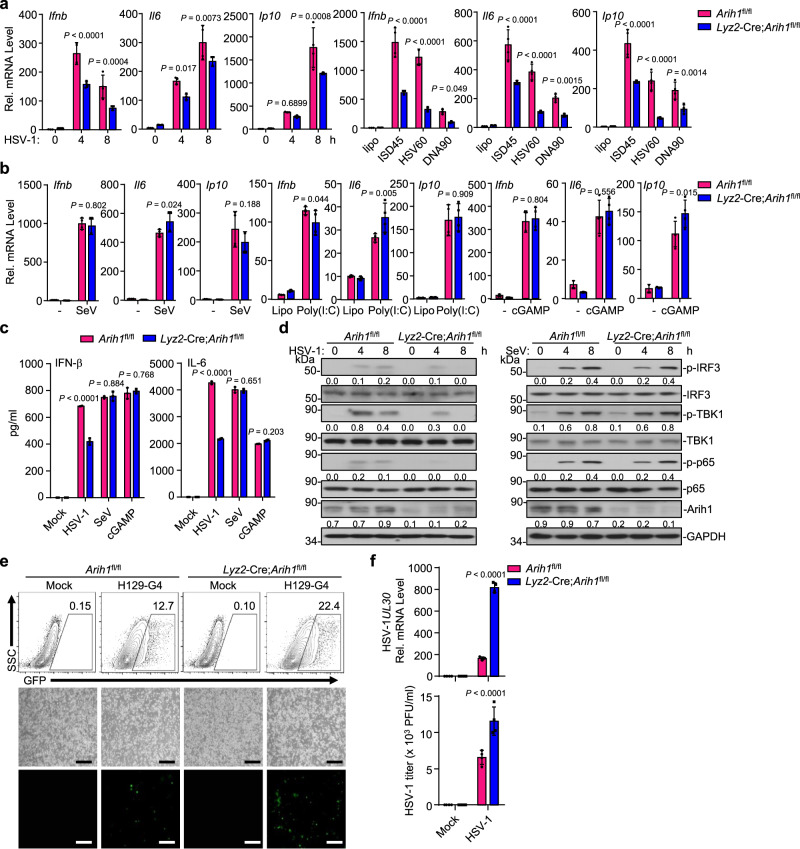
Fig. 2. Knockout of ARIH1 inhibits cellular antiviral responses against HSV-1.
a qRT-PCR analysis of Ifnb, Il6 and Ip10 mRNA in Arih1fl/fl and Lyz2-Cre;Arih1fl/fl BMDCs infected with HSV-1 for 0–8 h or transfected with ISD45, HSV60 or DNA90 (1 μg) for 8 h. b qRT-PCR analysis of Ifnb, Il6 and Ip10 mRNA in Arih1fl/fl and Lyz2-Cre;Arih1fl/fl BMDCs infected with SeV for 0–8 h or transfected with poly(I:C) (1 μg) or cGAMP (1 μg) for 0–4 h. c ELISA analysis of IFN-β and IL-6 in the supernatants of Arih1fl/fl and Lyz2-Cre;Arih1fl/fl BMDCs infected with HSV-1 or SeV for 12 h, or transfected with cGAMP (1 μg) for 12 h. d Immunoblot analysis of total and phosphorylated (p-) IRF3, TBK1 and p65, and ARIH1 and GAPDH in Arih1fl/fl and Lyz2-Cre;Arih1fl/fl BMDCs infected with HSV-1 (left) or SeV (right) for 0–8 h. e Flow cytometric analysis (upper flow charts) and fluorescent microscopy imaging (lower images) of the replication of H129-G4 (MOI = 0.5) in Arih1fl/fl and Lyz2-Cre;Arih1fl/fl BMDCs that were left uninfected or infected with H129-G4 for 1 h followed by twice PBS wash and culture in full medium for 24 h. Numbers adjacent to the outlined areas indicate percentages of GFP+ BMDCs. Scale bars represent 200 μm. f qRT-PCR analysis of HSV-1 UL30 mRNA in Arih1fl/fl and Lyz2-Cre;Arih1fl/fl BMDCs (upper graph) and plaque assays analyzing HSV-1 titers in the supernatants of Arih1fl/fl and Lyz2-Cre;Arih1fl/fl BMDCs (lower graph) infected with HSV-1 (MOI = 0.5) for 1 h followed by twice PBS wash and culture in full medium for 24 h. Data are representative of three (a-b) or two independent experiments (c–f). Graphs show mean ± S.D. (n = 4 for (a, b, f) or n = 3 for (c), biologically independent experiments). Statistical significance was determined using two-tailed Student’s t tests in (a–c, f). The quantitative anaylsis is derive from the same experiment and that blots were processed in parallel in (d). Source data are provided as a Source Data file.

