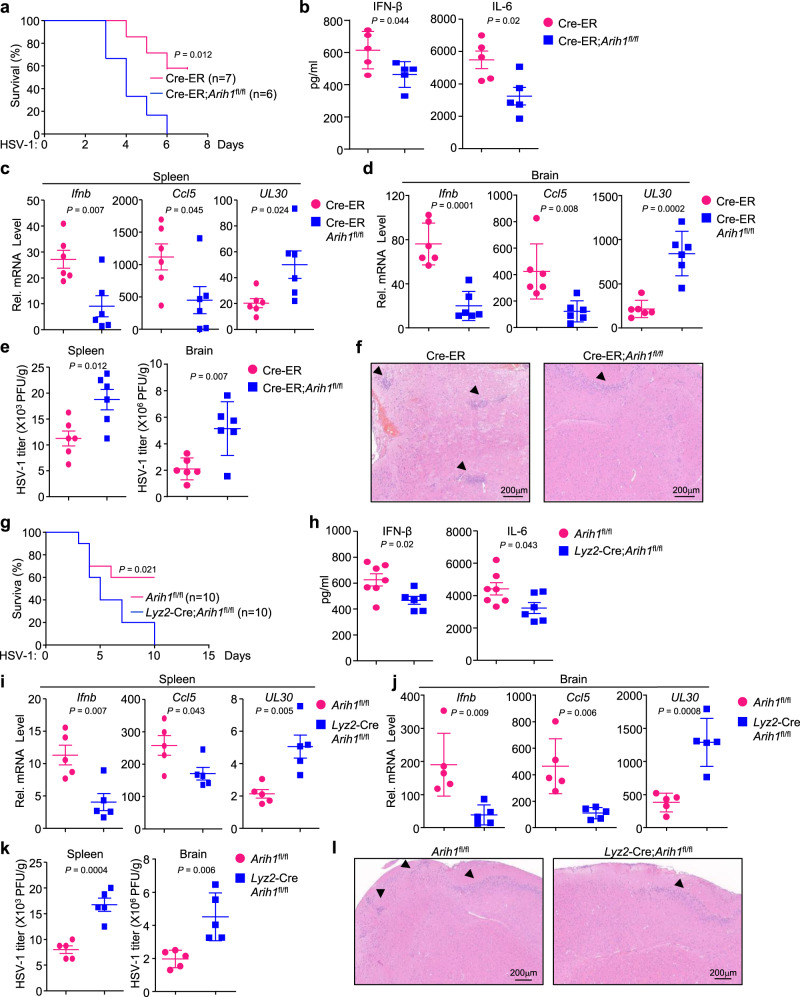
Fig. 3. ARIH1 deficiency leads to increased susceptibility to HSV-1 infection.
a Survival (Kaplan–Meier curve) of Cre-ER (n = 7) and Cre-ER;Arih1fl/fl mice (n = 6) intraperitoneally injected with tamoxifen for five successive days and rested for 5 days followed by intraperitoneal injection with HSV-1. b ELISA analysis of IFN-β and IL-6 in the sera of Cre-ER (n = 5) and Cre-ER;Arih1fl/fl mice (n = 5) treated as in (a) and intraperitoneally injected with HSV-1 for 12 h. c, d qRT-PCR analysis of Ifnb, Ccl5, and UL30 mRNA in the spleen (c) or brain (d) from Cre-ER (n = 6) and Cre-ER;Arih1fl/fl mice (n = 6) treated as in (a) and intraperitoneally injected with HSV-1 for 3 days. e Plaque assays analyzing HSV-1 titers in the spleen or brain from Cre-ER (n = 6) and Cre-ER;Arih1fl/fl mice (n = 6) treated as in (c). f Hematoxylin-eosin (HE) staining of brain sections of Cre-ER (n = 4) and Cre-ER;Arih1fl/fl mice (n = 4) treated as in (a) followed by intracerebral injection of HSV-1 for 3 days. g Survival of Arih1fl/fl (n = 10) and Lyz2-Cre;Arih1fl/fl mice (n = 10) intraperitoneally injected with HSV-1. h ELISA analysis of IFN-β and IL-6 in the sera of Arih1fl/fl (n = 7) and Lyz2-Cre;Arih1fl/fl mice (n = 6) intraperitoneally injected with HSV-1 for 12 h. i, j qRT-PCR analysis of Ifnb, Ccl5, and UL30 mRNA in the spleen and brain from Arih1fl/fl (n = 5) and Lyz2-Cre;Arih1fl/fl mice (n = 5) intraperitoneally injected with HSV-1 for 3 days. k Plaque assays analyzing HSV-1 titers in the spleen or brain from Arih1fl/fl (n = 5) and Lyz2-Cre Arih1fl/fl mice (n = 5) intraperitoneally injected with HSV-1 for 3 days. l HE staining of brain sections of Arih1fl/fl (n = 4) and Lyz2-Cre Arih1fl/fl mice (n = 4) intracerebrally injected with HSV-1 respectively for 3 days. 1 × 10⁷ PFU and 1 × 10⁶ PFU HSV-1 were injected with per mice in (a–e, g–k, f). l respectively. Data are of combined two independent experiments (a, g) or representative of two independent experiments (b–f, h–l). Graphs show mean ± S.D. (n = 5 for (b, i–k), or n = 6 for (c–e), or n = 7 and 6 for (h), biologically independent experiments). Statistical significance was determined using two-tailed Student’s t tests in (b–e, h–k). Source data are provided as a Source Data file.

