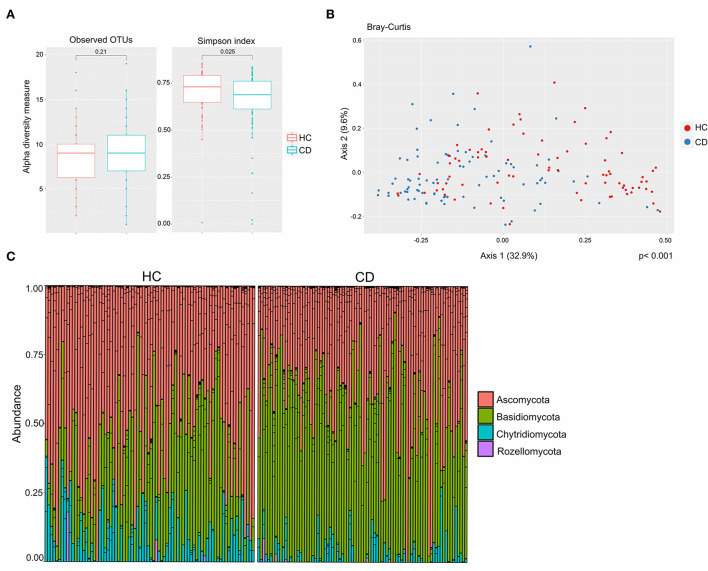
Figure 1.
The mucosa-associated mycobiota in Crohn's disease (CD) patients (n = 44) was altered in comparison to healthy controls (HC) (n = 40). (A) Alpha-diversity, according to observed operational taxonomic units (OTUs) (left) and Simpson index (right), boxplots colored according to disease phenotype (HC = red, CD = blue). (B) Beta-diversity. Principal coordinates analysis of Bray–Curtis dissimilarity with samples colored according to study group, (CD = blue and HC = red). The fraction of diversity captured by the coordinate is given in percentage on axes 1 and 2. Groups were compared using the Permanova method. (C) Relative abundance of fungal phyla in HC and CD patients.

