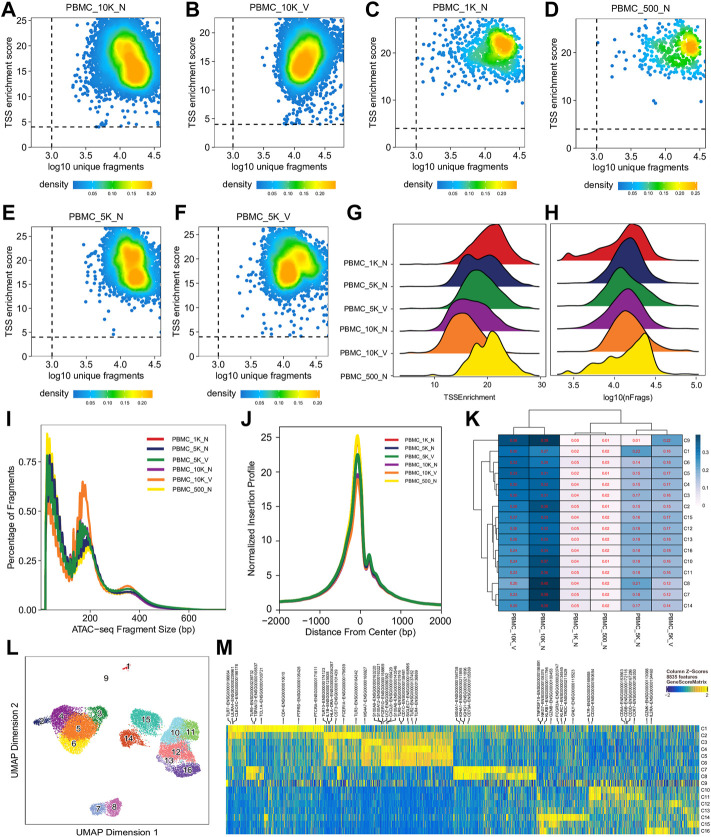
FIGURE 2.
Cell- and library-level QC of the human PBMC scATAC-seq data. Fragment files were generated for the six samples (outliers excluded) by the default preprocessing sub-workflow, and analyzed by the common ArchR-based downstream analysis sub-workflow. (A–F) Scatter plots showing bivariate distributions of TSS enrichment scores and log10 (unique fragments) of individual cells in each of the six libraries. (G,H) Ridge plots showing distributions of TSS enrichment scores and log10 (unique fragments) of individual cells per library, respectively. (I) Density plots showing insert size distributions per library. (J) Normalized insertion profiles along ±2-kb regions flanking TSSs. (K) Clustered heatmap showing proportions of cells per cluster from each library, with each row summing up to 1. (L) UMAP plot showing 16 clusters identified from the scATAC-seq data. (M) Heatmap showing cluster-specific marker genes across 16 clusters. Noticeably, cluster C9 has a noisy, weak pattern of marker genes, which suggests that it is very likely formed by doublets.

