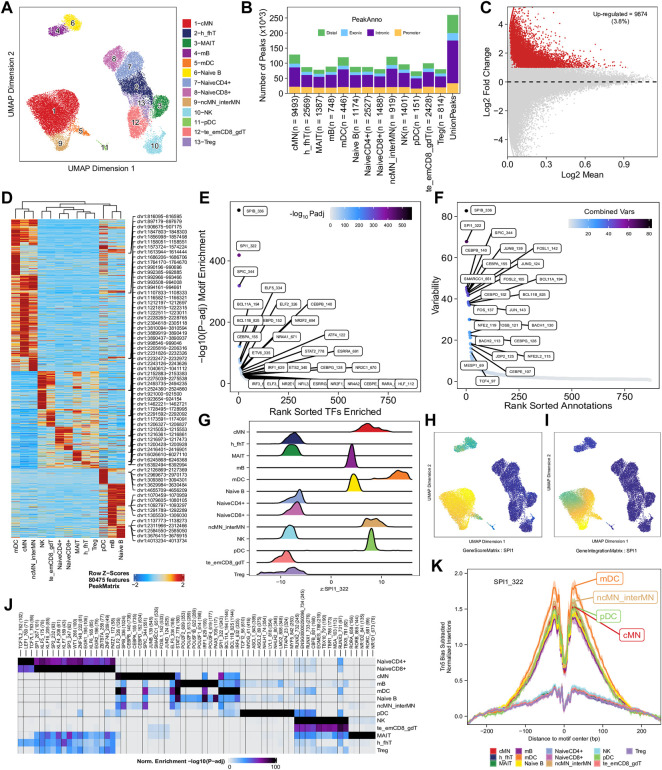
FIGURE 4.
Functional analysis of annotated clusters of the human PBMCs. (A) UMAP plot showing annotated clusters identified in the human PBMCs by integrating with the human PBMC scRNA-seq data. cMN, classic monocytes; h_fhT, T helper and T follicular helper cells; MAIT, mucosal-associated invariant T cells; mB, memory B cells, mDC, myeloid dendrtic cells; Naive B, naive B cells; NaiveCD4+, naive CD4+ T cells; NaiveCD8+, naïve CD8+ T cells; ncMN_interMN, non-classic monocytes and intermediate monocytes; NK, natural killer cells; pDC, plasmacytoid dendritic cells; te_emCD8_gdT, terminal effector CD8+ T cells, effector memory CD8+ T cells and γδT cells; Treg, T regulatory cells. (B) Distribution of reproducible peaks among different genomic features (promoter, intronic, exonic, and distal regions) in each cell type. (C) MA plot showing peaks preferentially accessible in intermediate and non-classic monocytes (FDR <0.01 and log2FC ≥ 1). (D) Heatmap showing 80,475 marker peaks across the 13 annotated clusters. (E) Dot plot showing top motifs enriched among marker peaks of intermediate and non-classic monocytes (ncMN_interMN). (F) Dot plot showing motifs of top variability scores across all the 13 cell types determined by ChromVAR. (G) Ridge plots showing distributions of the Z-score of motif deviation scores for SPI1_322 in each cell type. (H,I) UMAP plots showing gene scores and pseudo expression of a monocyte-specific TF, SPI1, whose motif is highly enriched in monocytes (cMN, interMN, and ncMN) and dendritic cells (mDC and pDC) and is of high deviations across clusters. (J) Heatmap showing normalized enrichment score, -log10 (adjusted p-value), of top TF motifs across the different cell types. (K) Aggregate footprints of SPI1_322 in each cell type.

