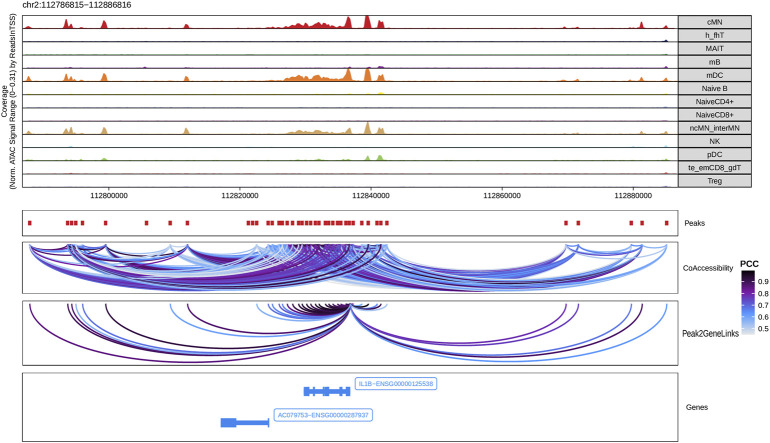
FIGURE 5.
Co-accessibility and peak-to-gene links in a IL1B-containing genomic region. The top panel shows the normalized read coverage in the genomic region of each cell type. The second panel shows peaks represented by red boxes. The third panel shows peak pairs, linked by colored arches, with co-accessibility scores (Pearson correlation coefficients) greater than 0.5. The fourth panel shows peaks linked to the IL1B promoter peak with co-accessibility score greater than 0.5. The fifth panel shows gene models of IL1B and AC079753 in this region.

