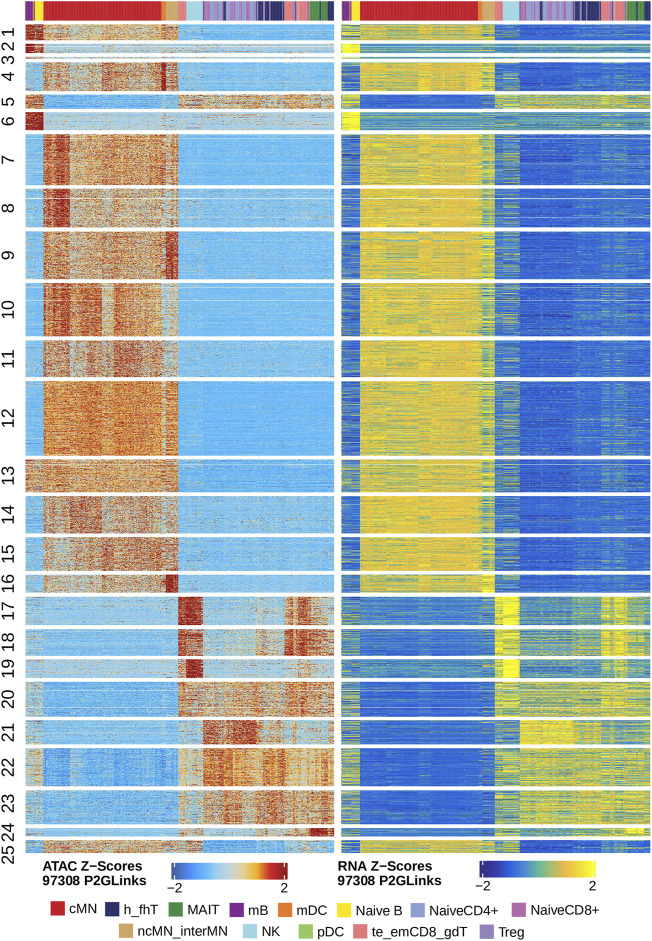
FIGURE 6.
Gene scores and pseudo expression of genes linked with peaks are highly consistent in different types of the human PBMCs. Heatmaps on the left and right panels show gene scores (derived from the scATAC-seq data) and pseudo expression (transferred from the scRNA-seq data) of genes linked to the peaks, respectively. Color bars on the top of each heatmap represent the PBMC clusters derived from the scRNA-seq data.

