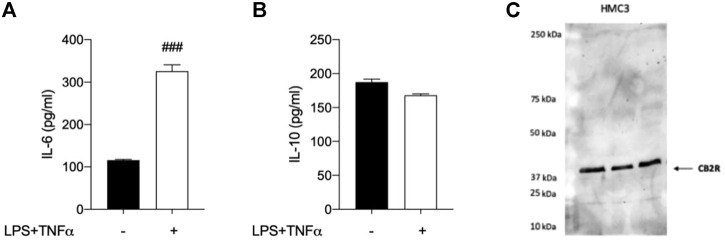
FIGURE 5.
Analysis of HMC3 cell line response to inflammatory stimulus and expression of CB2R. (A) Pro-inflammatory interleukin-6 (IL-6) and (B) anti-inflammatory interleukin-10 (IL-10) levels were measured after exposure to LPS (10 μg/ml)/TNFα (50 ng/ml) stimulus for 24 h. (C) Western Blot (WB) analysis allowed the detection of CB2R in control HMC3 cell lysates. [A-B]: data represent means ± S.E.M. from n = 3 independent experiments, performed in duplicate. Statistical analysis was performed by ordinary one-way ANOVA followed by Tukey’s multiple comparison test. ###p < 0.005 compared to control cells.

