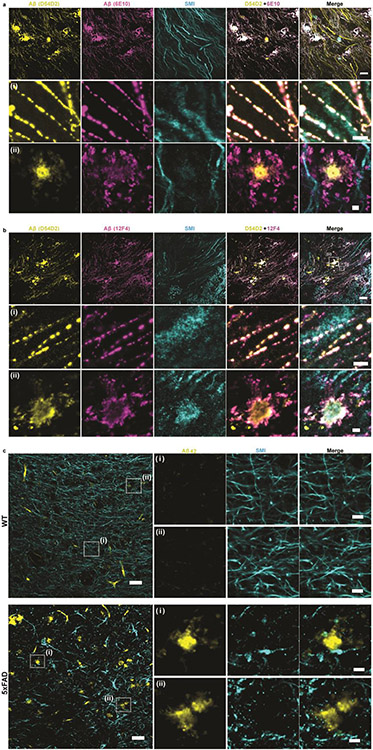
Extended Data Fig. 4. ExR and unexpanded tissue confocal images showing immunolabeling of Aβ42.
ExR confocal images (single z-slices) showing immunolabeling of Aβ42 with two different monoclonal antibodies (a) D54D2 + 6E10 and (b) D54D2 + 12F4 with SMI co-staining in the fornix of 5xFAD mouse (n = 3 fields of view of 2 slices from 2 mice). Scale bar, 10 μm (top row), 1 μm (i, ii panels). (c) Unexpanded tissue confocal image, a single z-slice, showing pre-expansion Aβ42 (yellow) and SMI (cyan) staining in the fornix of WT (upper panel) and 5xFAD mice (lower panel) (n = 3 fields of view of 1 slice from 1 mouse per WT and 5xFAD, respectively). Scale bar, 30 μm (left panel) and 6 μm (panels i, ii)).

