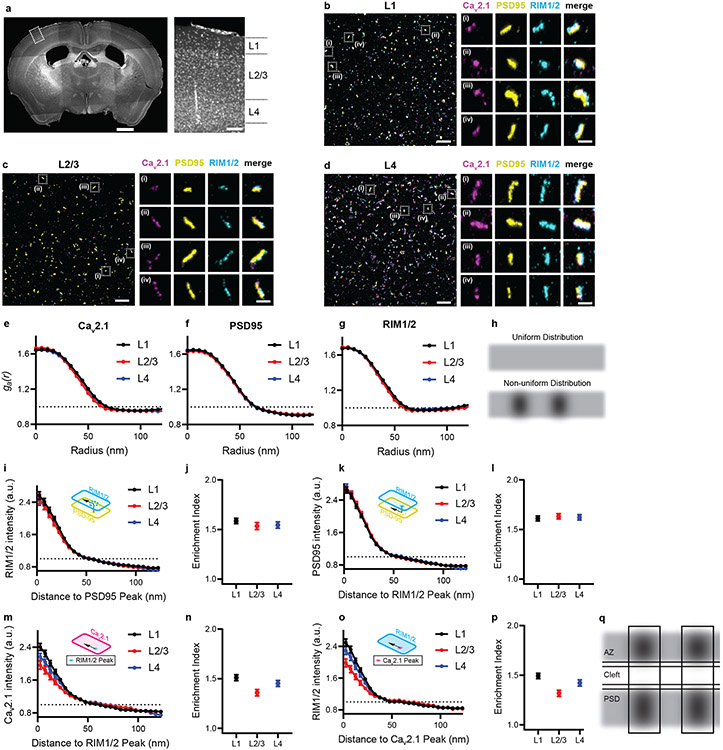
Fig. 4 ∣. ExR reveals how calcium channel distributions participate in transsynaptic nanoarchitecture.
(a) Low-magnification widefield image of DAPI stained mouse brain slice (left) and zoomed in view (right) of the boxed region showing layers 1-4 of the cortex. (Scale bar = 1000 μm (left panel of whole brain) and 100 μm (right panel of the layers 1-4). (b-d) show confocal images (max intensity projections) of layers 1, 2/3 and 4 respectively, after performing ExR and immunostaining with antibodies against Cav2.1 (calcium channel) (magenta), PSD95 (yellow) and RIM1/2 (cyan). In each of (b), (c) and (d), low magnification images are shown on the left while zoomed-in images of four regions, i-iv are shown on the right with separated channels for each antibody along with the merged image. (Scale bar = 1 μm (left panel) and 100 nm (right panels labelled i-iv)). Shown are images from one representative experiment from two independent replicates. (e-g) show the autocorrelation analysis for Cav2.1, PSD95 and RIM1/2 respectively for different layers. (h) shows schematic illustration of protein distribution based on interpretation of autocorrelation results in (e-g). A uniform distribution (h, top) would be predicted if ga(r) = 1 at all radii (dotted lines in e-g), whereas a non-uniform distribution with one or more regions of high local intensity (h, bottom) would be predicted if ga(r) was greater than 1 at short radii and decayed as the radius is increased. (i), (k), (m) and (o) show the enrichment analysis that calculates the average molecular density for RIM1/2 to the PSD95 peak, PSD95 to the RIM1/2 peak, Cav2.1 to the RIM1/2 peak and RIM1/2 to the Cav2.1 peak respectively while (j), (l), (n) and (p) show the corresponding mean enrichment indexes respectively (see Methods for exact n - values). Error bars indicate SEM. (q) shows schematic illustration of protein distribution based on interpretation of enrichment analysis results in (i-p). Enrichment values above 1 represent regions of high local intensity in the measured channel, so the enrichment profiles in (i), (k), (m) and (o) suggest the peak of the reference channel closely aligns with regions of high intensity in the measured channel for each of the four comparisons. Therefore, this suggests that enriched regions of any two proteins (RIM1/2, PSD95 and Cav2.1) are aligned in nanoscale precision with each other. Calcium channels located close to vesicle fusion sites (dictated by RIM1/2) may enhance the calcium-sensitivity of fusion. Additionally, postsynaptic receptors may be exposed to higher, faster peaks of neurotransmitter concentration when vesicle release sites are located directly opposite receptor nanoclusters (PSD95 being a receptor-anchoring protein). (AZ: active zone, PSD: postsynaptic density).

