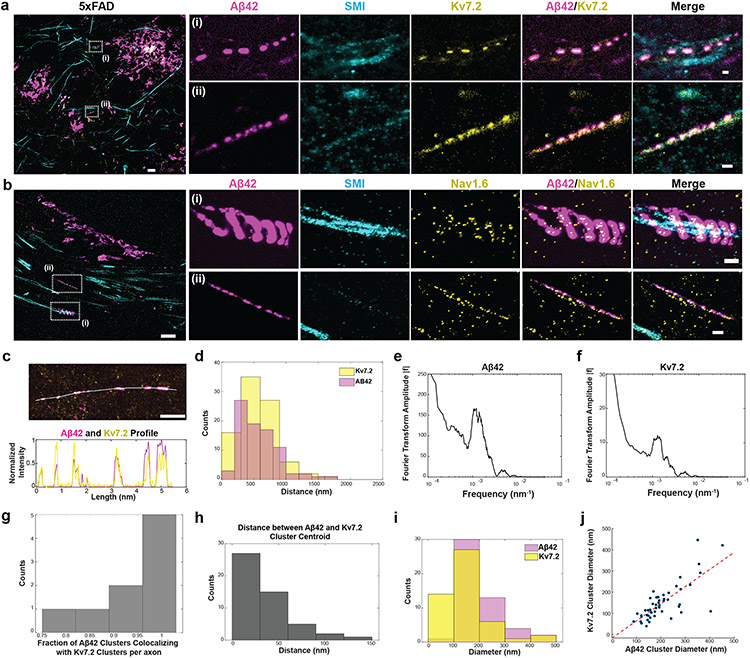
Fig. 6 ∣. ExR reveals co-localized clusters of Aβ42 peptide with potassium and sodium ion channels in the fornix of Alzheimer’s model 5xFAD mice.
(a-b) ExR confocal image (max intensity projections) showing post-expansion (a) Aβ42 (magenta), SMI (cyan) and Kv7.2 (yellow) staining, and (b) Aβ42 (magenta), SMI (cyan) and Nav1.6 (yellow) staining in the fornix of a 5xFAD mouse. Leftmost panel, merged low magnification image. (Scale bar = 4 μm); insets (i-ii) show close-up views of the boxed regions in the leftmost image for (A) Aβ42, SMI, Kv7.2, Aβ42-Kv7.2 merged and Aβ42-Kv7.2-SMI merged respectively, and (b) Aβ42, SMI, Nav1.6, Aβ42-Nav1.6 merged and Aβ42-Nav1.6-SMI merged respectively (scale bar = 400 nm; n = 5 fields of view from 2 slices from 2 mice). (c) ExR confocal image (max intensity projections) showing Aβ42 (magenta) and Kv7.2 (yellow) clusters in a 5xFAD mouse (top) with the indicated cross-section profile shown (bottom). (Scale bar = 1 μm). Shown are images from one representative experiment from four independent replicates. (d) Histograms showing distances between adjacent Aβ42 (magenta) and Kv7.2 (yellow) clusters in 5xFAD mice along imaged segments of axons (n=97 Aβ42 clusters, 92 Kv7.2 clusters from 9 axonal segments from 2 mice). (e-f) Fourier transformed plots of Aβ42 (e) and Kv7.2 (f) showing the same peak position (from the same data set as (d)). (g) Histogram showing the fraction of Aβ42 clusters colocalizing with Kv7.2 clusters along individual segments of axons (n=50 cluster pairs from 9 axonal segments from 2 mice). (h) Histogram showing the distance between the centroids of colocalized Aβ42 and Kv7.2 clusters (same data set as (d)). (i) Histograms showing the diameters of Aβ42 clusters (magenta) and Kv7.2 clusters (yellow) (n=50 cluster pairs from 9 axonal segments from 2 mice). (j) Scatter plot showing the diameters of colocalized Aβ42 and Kv7.2 clusters.

