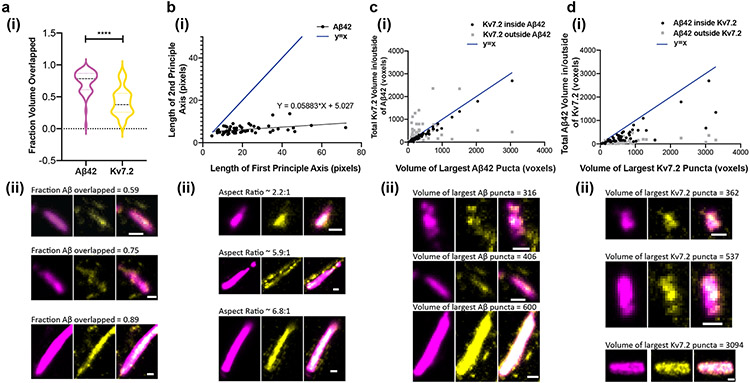
Fig. 7 ∣. Analysis of Aβ42 peptide and potassium ion channels nanoclusters in shapes and their relationships.
(a)(i) Fraction of total Aβ42 and Kv7.2 puncta volume overlapped with one another in cropped Aβ42 clusters (n = 55 clusters from 2 5xFAD mice; p < 0.0001, two-sided pairwise t-test). ****P < 0.0001. (a)(ii) Representative images illustrating the difference in the proportion of mutually overlapped volume between Aβ42 and Kv7.2 as a fraction of total Aβ42 or Kv7.2 volume (scale bar = 100nm). (b)(i) Length of the second principal axis of the ellipsoid that has the same normalized second central moments as the largest Aβ42 punctum in an ROI, vs. the length of the first principal axis of this ellipsoid (in pixels, 1 pixel = 11.44 nm in x- and y-directions (transverse) and 26.67nm in the z-direction (axial); black points represent individual manually cropped ROIs; slope of best-fit line from simple linear regression = 0.05883, p = 0.0020, F = 10.59, df = 53). Compare to the line y = x (blue). (b)(ii) Representative images illustrating the oblong shape of Aβ42 puncta, for three first principal axis lengths: shorter (top row), medium (middle row) and longer (bottom row). While the length of the first principal axis varies significantly between these examples, the length of the second principal axis remains similar between the three clusters. (c)(i) Total volume (in voxels, 1 voxel = 11.44x11.44x26.67 or 3,490 nm3) of Kv7.2 puncta overlapped/inside (black, R2 = 0.980, p < 0.0001) and outside (gray, R2 = 0.0582, p = 0.0979) Aβ42 puncta, as a function of the volume of the largest Aβ42 puncta within an ROI, compared to the line y = x (blue). (c)(ii) Representative images illustrating that the volume of Kv7.2 outside of Aβ42 is relatively constant as Aβ42 puncta size increases. As in (b)(ii), the three clusters shown are ordered by increasing size. (d) The converse of (c): total volume of Aβ42 puncta overlapped/inside (black, R2 = 0.6531, p < 0.0001) and outside (gray, R2 = 0.1876, p = 0.0010) of Kv7.2 puncta, as a function of the volume of the largest Kv7.2 puncta within an ROI, compared to the line y = x (blue). (d)(ii). Representative images illustrating that the volume of Aβ42 outside of Kv7.2 is smaller than the volume of Aβ42 co-localized with Kv7.2, and both values are positively correlated with the volume of the largest Kv7.2 puncta. Scale bar of (a-d ii) = 100 nm. Shown are images from one representative experiment from four independent replicates.

