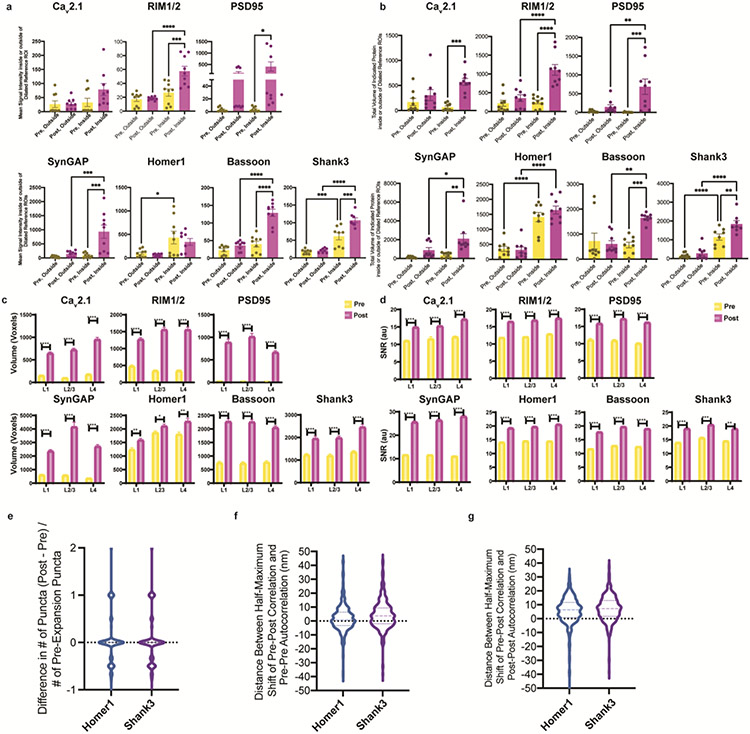
Extended Data Fig. 2. Analysis of the ExR decrowding effect.
(a, b) Quantification of decrowding in a set of manually identified synapses. Statistical significance was determined using Sidak’s multiple comparisons test on two-sided t-tests following ANOVA (*P ≤ 0.05, **P ≤ 0.01, ***P < 0.001, ****P < 0.0001, here and throughout the paper, and plotted is the mean, with error bars representing standard error of the mean (SEM), here and throughout the paper). (a) Mean signal intensity inside and outside of (that is, nearby to) dilated reference ROIs for pre- and post-expansion stained manually-identified synapses (Supplementary Table 2 for numbers of technical and biological replicates)). Data points represent the mean across all synapses from a single field of view. (b) Total volume (in voxels; 1 voxel = 17.16 × 17.15 × 40, or 11,779, nm3) of signals inside and outside of dilated reference ROIs, in both cases within cropped images containing one visually identified synapse (Supplementary Fig. 3h), for pre- and post-expansion stained manually-identified synapses (Supplementary Table 2 for numbers of biological and technical replicates). Data points represent the mean across all synapses for 3 fields of view from 3 biological replicates (n = 9 fields of view total per protein). (c) Mean voxel size and (d) mean signal-to-noise (SNR) ratio of pre- and post-expansion immunostaining showing 7 proteins in somatosensory cortex regions L1, L2/3, and L4 of 3 mice. Plotted is mean and SEM. To compare the 3D voxel size and SNR of pre- and post-expansion stained synapses for each of the seven proteins, three two-sided t-tests (one for each layer) were run (n = 49-70 puncta per layer from 3 mice; Supplementary Table 2 for exact n values). Statistical significance was determined using multiple t-tests corrected using the Holm-Sidak method, with alpha = 0.05. (e) Population distribution (violin plot of density, with a dashed line at the median and dotted lines at the quartiles) of the fractional difference in the number of synaptic puncta between post- and pre-expansion staining channels for Homer1 and Shank3 (n = 480 synapses from 3 mice). (f) Population distribution of the difference in distance (in nm) between the shift at which the correlation is half maximal half-maximal shift for pre-pre autocorrelation and post-pre correlation (calculated pixel-wise between intensity values normalized to the minimum and maximum of the image, see Methods) for x-, y-, and z-directions (x- and y-directions being transverse, z-direction being axial) for Homer1 and Shank3 (n = 458 synapses, 3 directions each, from 3 mice). (g) Same as (f), for post-post autocorrelation and pre-post correlation.

