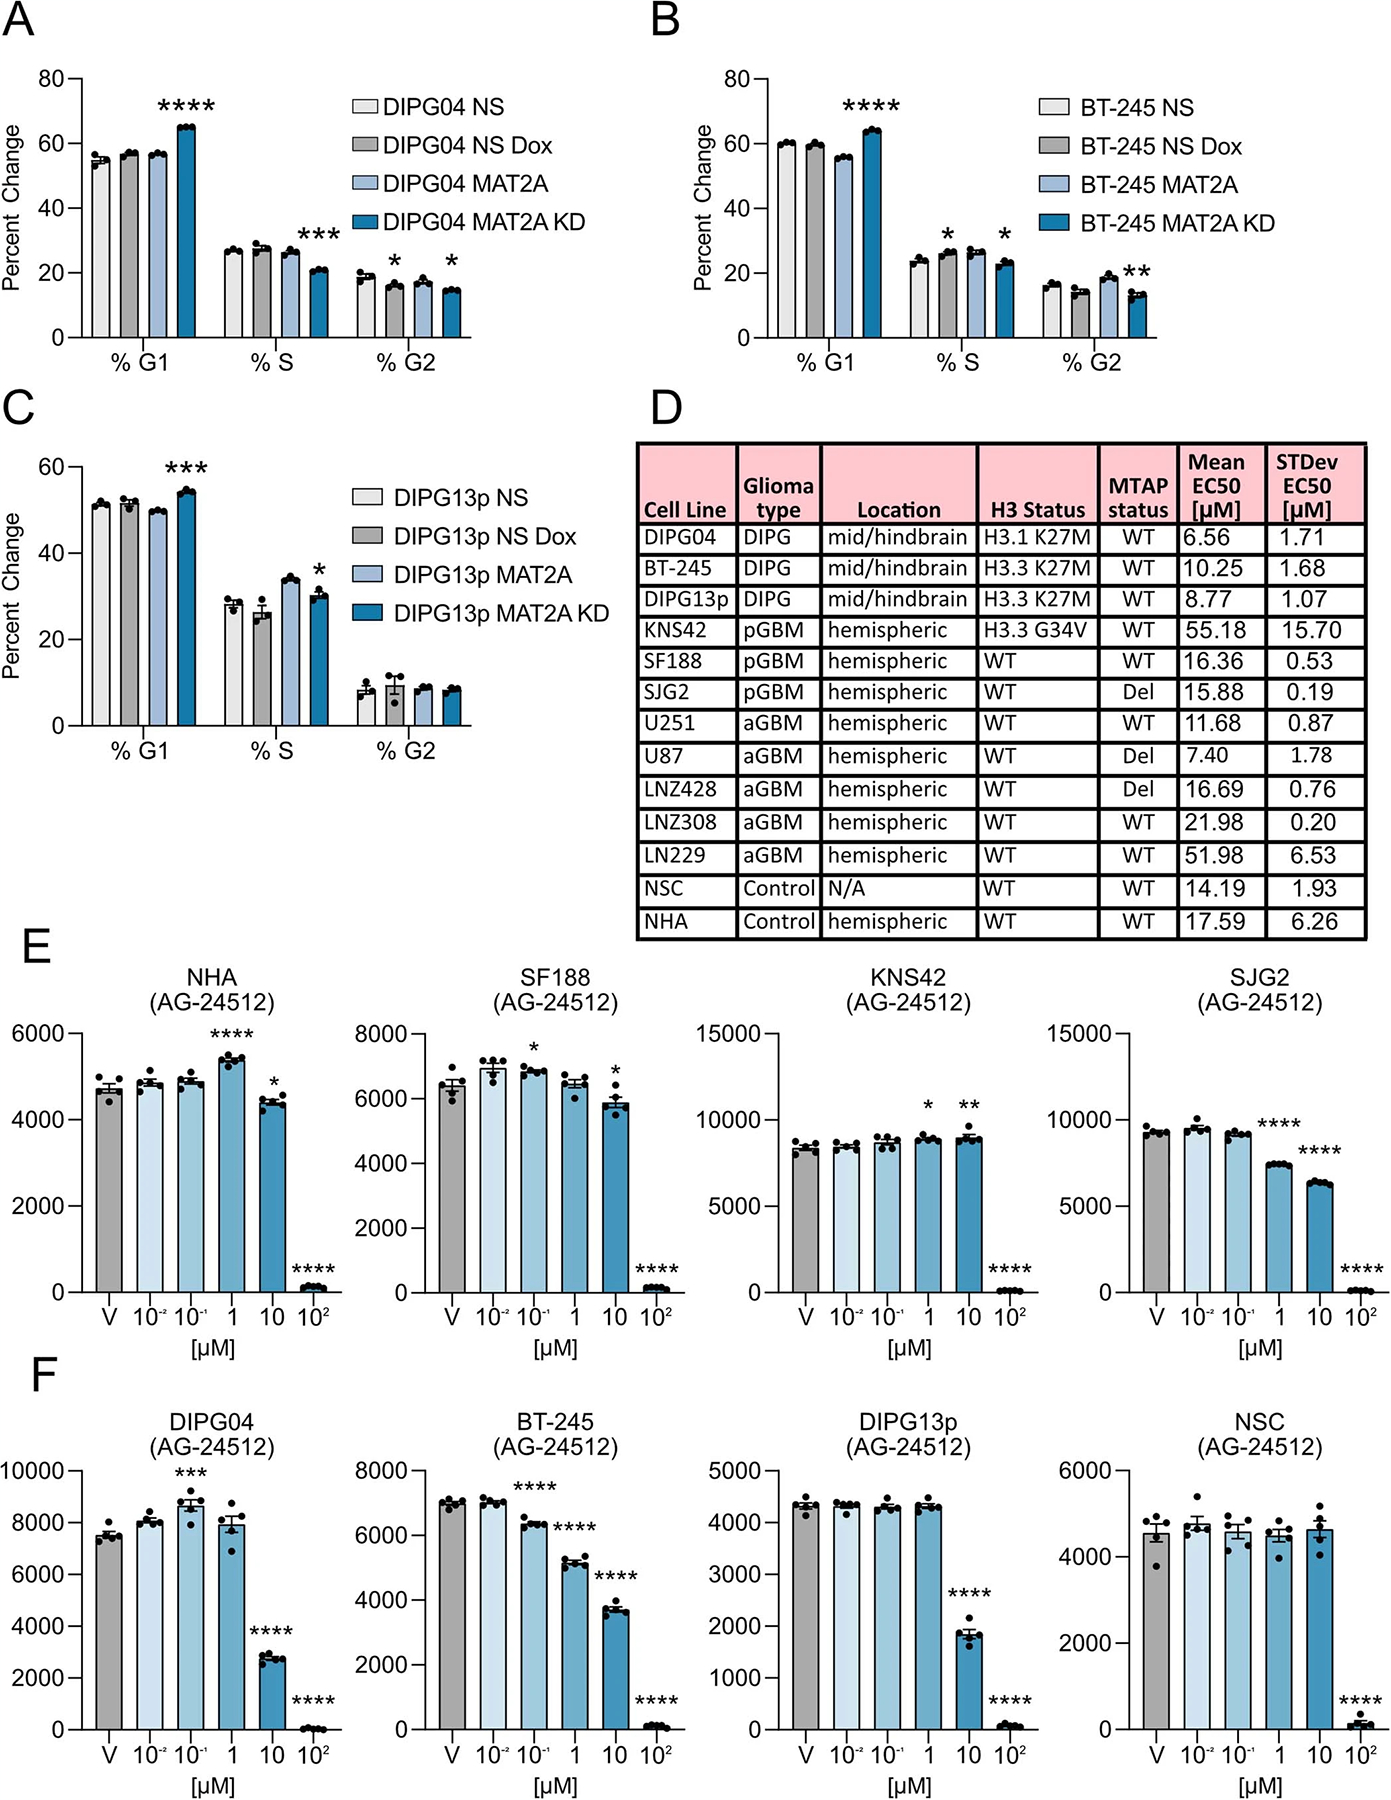
Extended Data Fig. 3 |. Effect of MAT2A inhibition in glioma lines. A-C.

Cell cycle analysis of control DMG cells compared to MAT2A knockdowns in (A) DIPG04, (B) BT-245 (C) DIPG13p. Experiments performed in biological triplicate. Statistical analysis as two-tailed, unpaired-T test. Data is displayed as mean± s.e.m. ((A) (DIPG04 NS No Dox vs. DIPG04 NS Dox %G2 *p=0.047), (DIPG04 MAT2A No Dox vs. Dox %G1 ****p=0.000004, %S ***p=0.000561, %G2 *p=0.014235). ((B) (BT-245 NS No Dox vs. Dox %S *p=0.041398), (BT-245 MAT2A No Dox vs. Dox %G1 ****p=0.000013, %S *p=0.017414, %G2 **p=0.004338). ((C) DIPG13p MAT2A No Dox vs. Dox %G1 ***p=0.000194, %S *p=0.011396). *p<0.05, **p<0.01, ***p<0.001, ****p<0.0001. p>0.05 not displayed. D. Summary of cell line features for MAT2A inhibitor viability response. E. Non-DMG/DIPG lines: Alamar blue viability response to varying doses of AG-24512. Experiments performed were in 5 biological replicates. Statistical analysis was performed using a one-way ANOVA followed by a Dunnett’s multiple comparison test. Data is displayed as mean± s.e.m. Adjusted P-values as follows: ((NHA) DMSO vs. 1 μM ****p<0.0001, DMSO vs. 10 μM *p=0.0107, DMSO vs. 100 μM ****p<0.0001), ((SF188) DMSO vs. 0.1 μM *p=0.0237, DMSO vs.10 μM *p=0.0297, DMSO vs. 100 μM ****p<0.0001), ((KNS42) DMSO vs. 1 μM *p=0.0269, DMSO vs. 10 μM **p=0.0086, DMSO vs. 100 μM ****p<0.0001), ((SJG2) DMSO vs. 1 μM ****p<0.0001, DMSO vs. 10 μM ****p<0.0001, DMSO vs. 100 μM ****p<0.0001). *p<0.05, **p<0.01, ***p<0.001, ****p<0.0001. p>0.05 not displayed. F. H3K27M mutant DIPG lines: Alamar blue viability in response to varying doses of AG-24512. Experiments performed were in 5 biological replicates. Statistical analysis was performed using a one-way ANOVA followed by a Dunnett’s multiple comparison test. Data is displayed as mean± s.e.m. Adjusted P-values as follows: ((DIPG04) DMSO 0.1 μM ***p=0.0004, DMSO vs. 10 μM ****p<0.0001, DMSO vs. 100 μM ****p<0.0001), ((BT-245) DMSO vs. 0.1, 1, 10, 100 μM ****p<0.0001), ((DIPG13p) DMSO vs. 10, 100 μM ****p<0.0001), ((NSC) DMSO vs. 100 μM ****p<0.0001). *p<0.05, **p<0.01, ***p<0.001, ****p<0.0001. p>0.05 not displayed.
