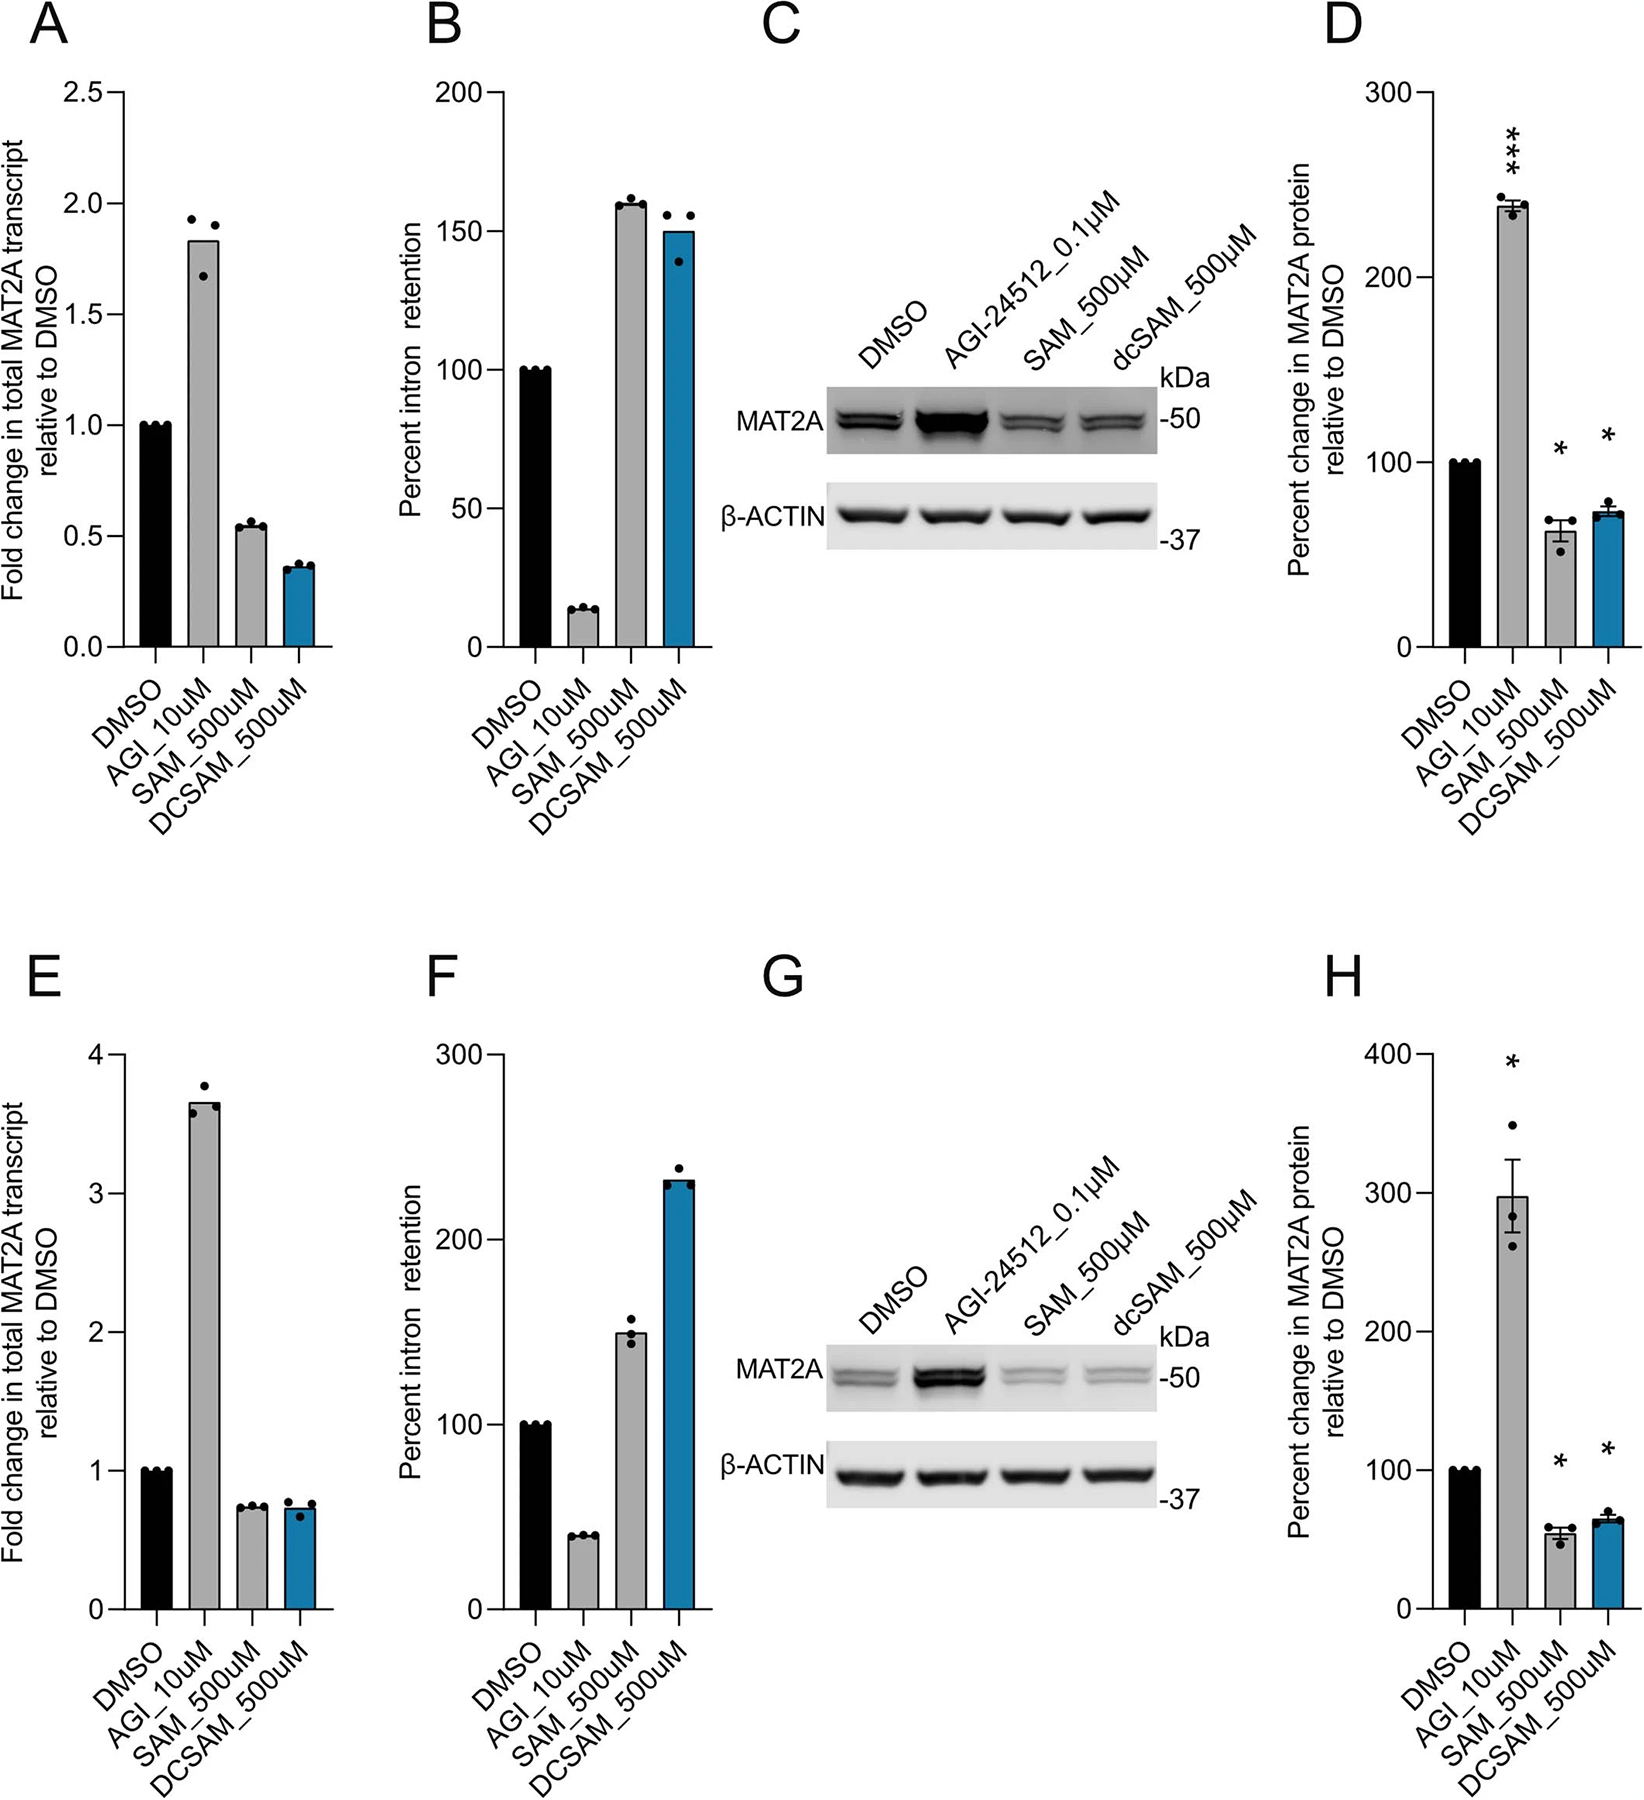
Extended Data Fig. 5 |. The effects of dcSAM on MAT2A intron retention and protein stability.

A. Fold change in total MAT2A transcript levels relative to DMSO control in DIPG04 cells incubated for 6 hours in the following: 0.1 μM AGI-24512, 500 μM SAM and 500 μM dcSAM. Experiment was performed once, and samples were repeatedly measured in triplicate for each condition. B. Percent Intron 8 retention in total MAT2A transcript in DIPG04 cells incubated for 6 hours in the following: 0.1 μM AGI-24512, 500 μM SAM and 500 μM dcSAM. Experiment was performed once, n=3 technical replicates for each condition. C. Quantitative western blotting of MAT2A protein and actin in DIPG04 cells incubated for 48 hours in the following: 0.1 μM AGI-24512, 500 μM SAM and 500 μM dcSAM. D. Quantification of westerns from C) using Li-Cor fluorescent system. Biological replicate of n=3. Biological samples were measured 3 times and the average intensity was plotted for each biological replicate. Adjusted P-values as follows: (DMSO vs. AGI 10 μM ***p=0.0009), (DMSO vs. SAM 500 μM *p=0.0439), and (DMSO vs. dcSAM 500 μM *p=0.0189). *p<0.05, **p<0.01, ***p<0.001, ****p<0.0001. E. Fold change in total MAT2A transcript levels relative to DMSO control in NSC-PT2 cells incubated for 6 hours in the following: 0.1 μM AGI-24512, 500 μM SAM and 500 μM dcSAM. Experiment was performed once, and samples were repeatedly measured in triplicate for each condition. F. Percent intron 8 retention in total MAT2A transcript in NSC-PT2 cells incubated for 6 hours in the following: 0.1 μM AGI-24512, 500 μM SAM and 500 μM dcSAM. Experiment was performed once, n=3 technical replicates for each condition. G. Quantitative Western blotting of MAT2A protein and actin in NSC-PT2 cells incubated for 48 hours in the following: 0.1 μM AGI-24512, 500 μM SAM and 500 μM dcSAM. H. Quantification of westerns from G) using Li-Cor fluorescent system. Biological replicate of n=3. Biological samples were measured 3 times and the average intensity was plotted for each biological replicate. Adjusted P-values as follows: (DMSO vs. AGI 10 μM *p=0.033), (DMSO vs. SAM 500 μM *p=0.0153), and (DMSO vs. dcSAM 500 μM *p=0.0116). ((D, H) Statistical analysis performed as a repeated measures one-way ANOVA followed by Dunnett’s multiple comparisons test. Data displayed as mean ± s.e.m.).
