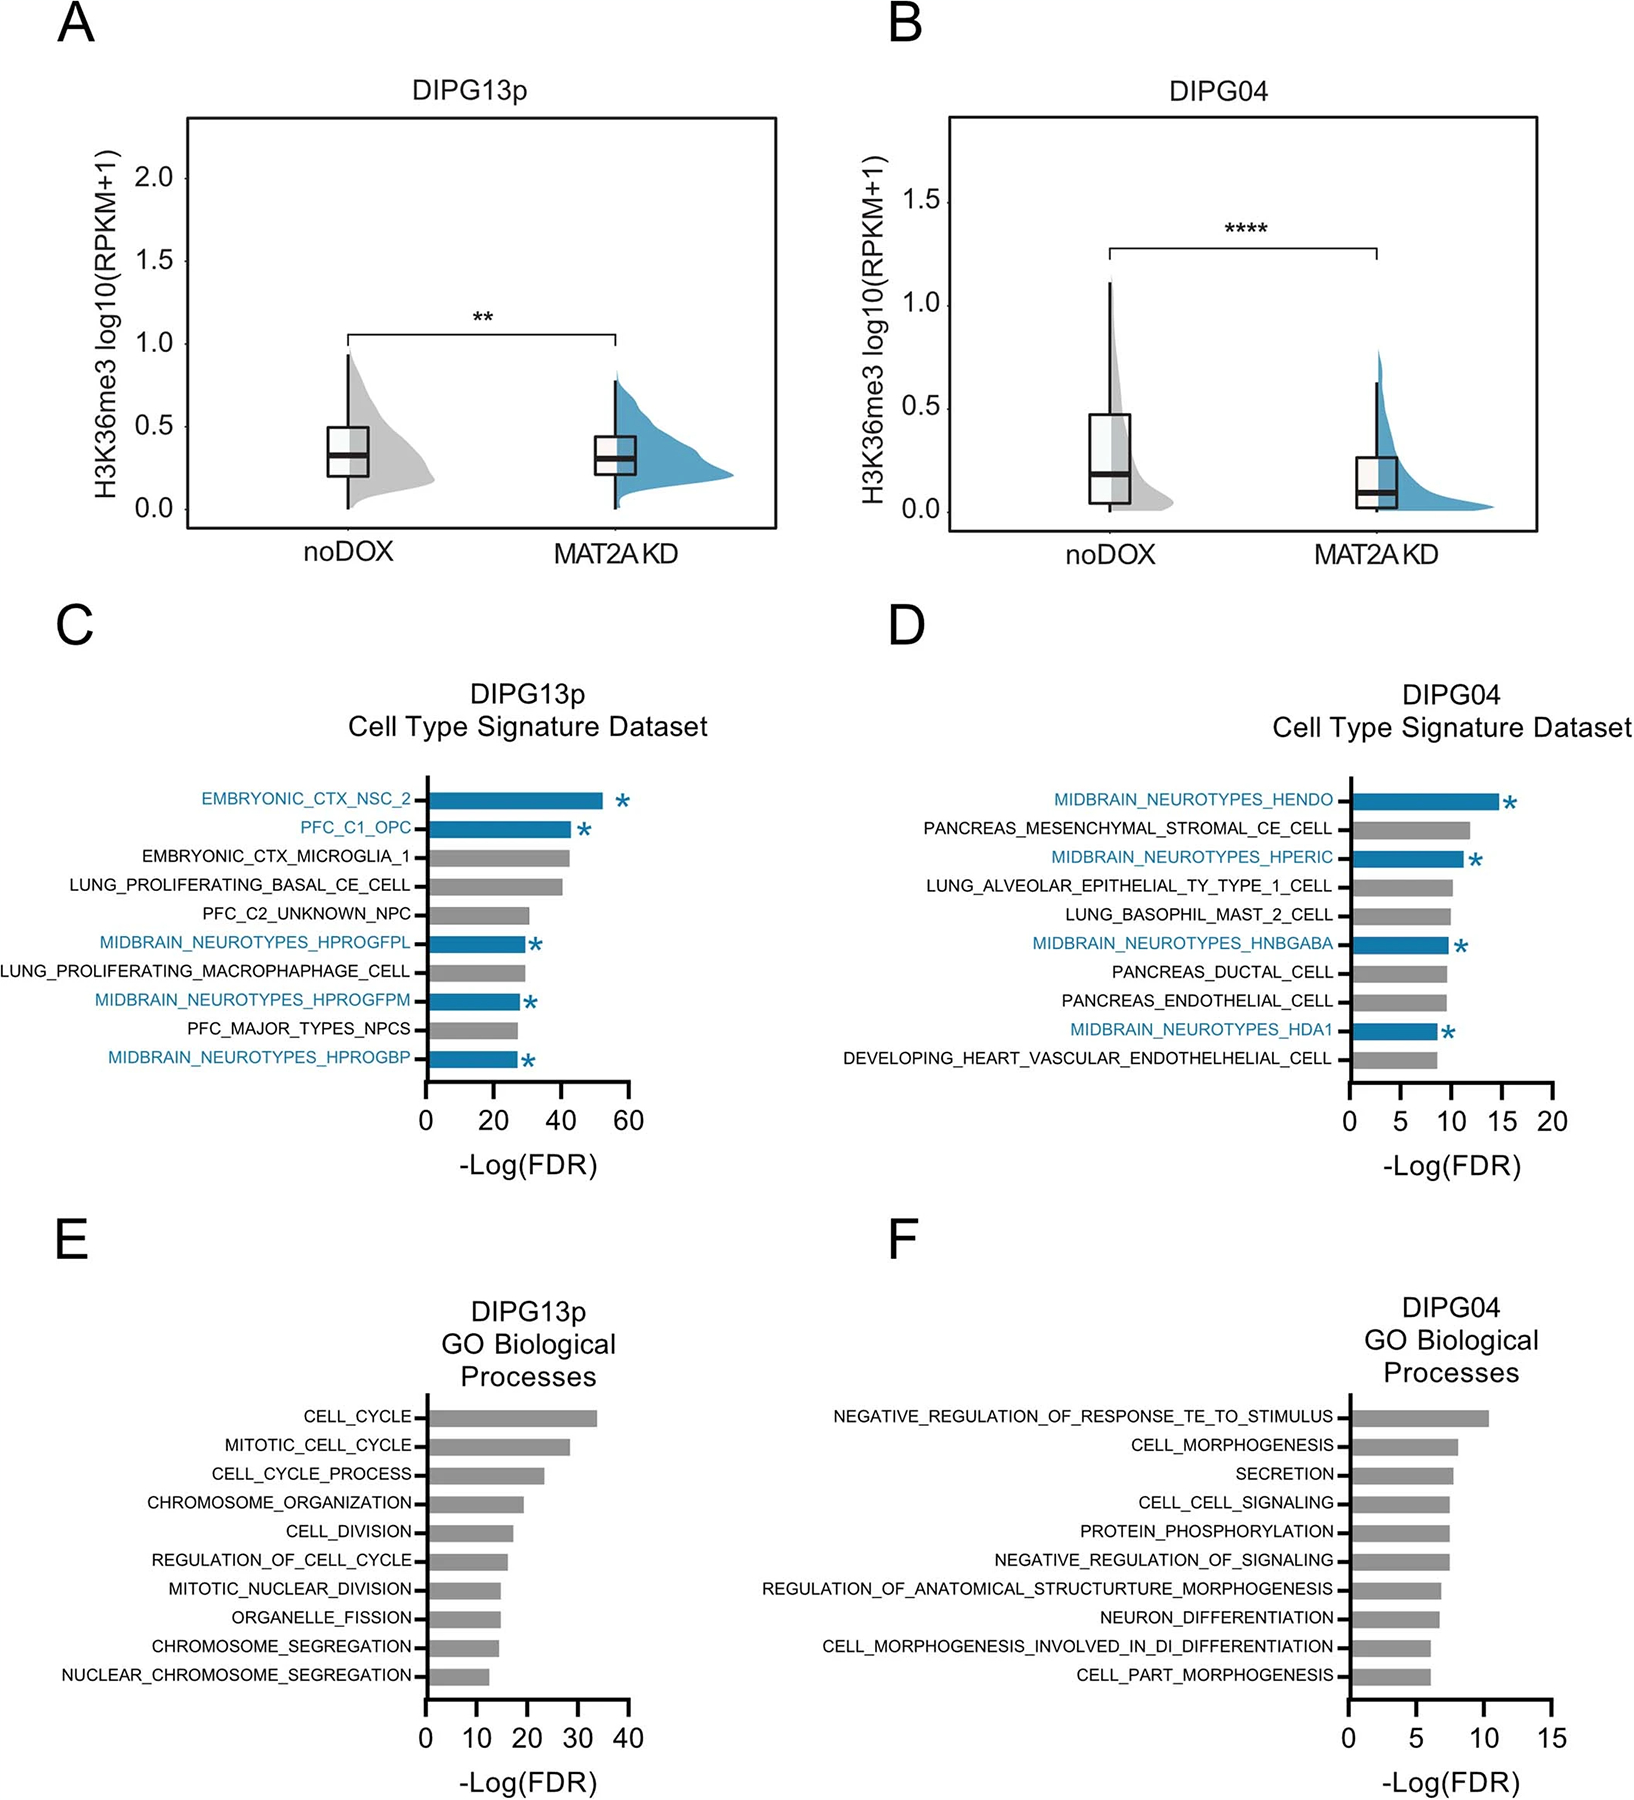
Extended Data Fig. 9 |. MAT2A knockdown decreases H3K36me3 globally in DMG cells.

A. Plot Showing a decrease in H3K36me3 signal with MAT2A KD in DIPG13p cells. Statistical analysis was performed on 1 Mb bins comparing a single DIPG13p sample with Mat2a KD vs control (no doxycycline) using a two-sided Wilcoxon test, **p=0.0013, the center line denotes the median and the lower and upper ends of the box denote the 25th and 75th percentiles respectively. The whiskers indicate the maximum and the minimum values of the data distribution. B. Plot Showing a decrease in H3K36me3 signal with MAT2A KD in DIPG04 cells. Statistical analysis was performed on 1 Mb bins comparing a single DIPG04 sample with Mat2a KD vs control (no doxycycline) using a two-sided Wilcoxon test, ****p<2.22e-16., the center line denotes the median and the lower and upper ends of the box denote the 25th and 75th percentiles respectively. The whiskers indicate the maximum and the minimum values of the data distribution. C, D. GSEA analysis using Cell Type Signature Datasets in DIPG13p (C) and DIPG04 (D) with genes which are significantly differential in both RNA-seq and ChIP datasets after MAT2A KD. E, F. GSEA analysis using GO Biological Processes Datasets in DIPG13p (E) and DIPG04 (F) with genes which are significantly differential in both RNA-seq and ChIP datasets after MAT2A KD.
