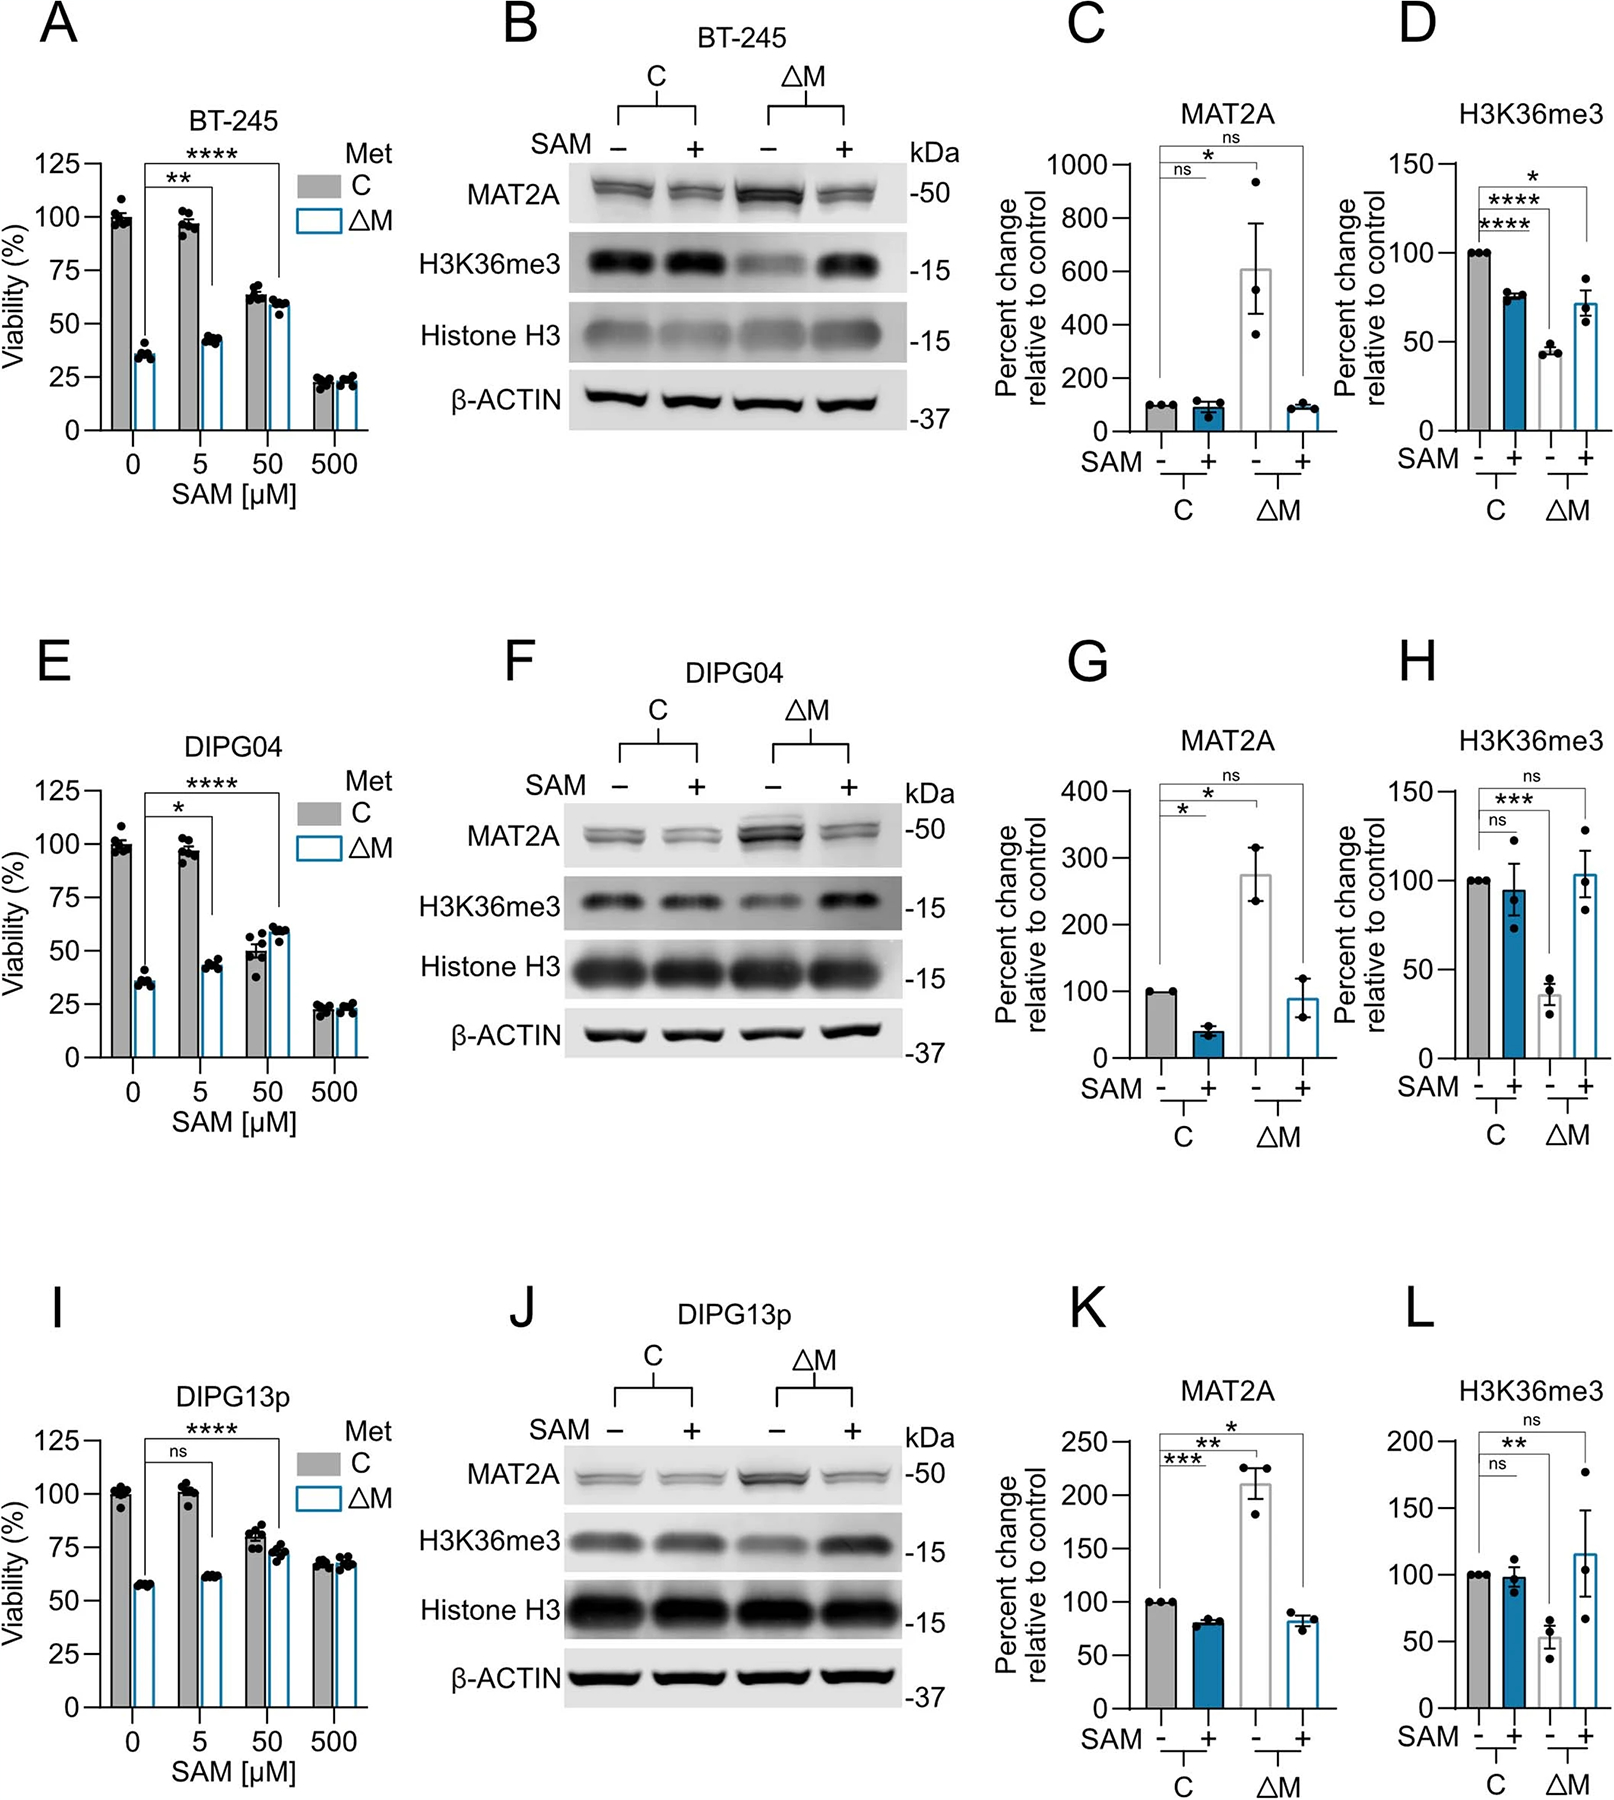
Extended Data Fig. 10 |. Methionine Restriction induced viability defect and total H3K36me3 loss can be rescued with SAM repletion in DMG cells.

A. Percent viable cell count of BT-245 cells grown in media with 10% of normal methionine levels relative to control (100%) and supplemented with escalating concentrations of SAM. Adjusted P-values as follows: (10%Met 0 μMSAM vs. 10%Met 5 μM SAM **p=0.0042), and (10%Met 0 μMSAM vs. 10%Met 50 μM SAM ****p<0.0001). B. Quantitative western blotting of MAT2A, H3K36me3, and histone H3 in BT-245 cells comparing 10% methionine media with 100% supplemented with 500 μM of SAM. C, D. Quantification of MAT2A and H3K36me3 using Li-Cor fluorescent system for BT-245 cells comparing. 10% methionine media with 100% supplemented with 500uM of SAM. Biological replicate of n=3, samples were repeatedly measured 3 times. ((C) (100%Met vs. 100%+SAM p=0.7178), (100%Met vs. 10%Met *p=0.0394), and (100%Met vs. 10%Met+SAM p=0.3989). ((D) (100%Met vs. 100%+SAM ****p<0.0001), (100%Met vs. 10%Met ****p<0.0001), and (100%Met vs. 10%Met+SAM *p=0.0171). E. Percent viable cell count of DIPG04 cells grown in media with 10% of normal methionine levels relative to control (100%) and supplemented with escalating concentrations of SAM. Adjusted P-values as follows: (10%Met 0 μMSAM vs. 10%Met 5 μM SAM *p=0.0141), and (10%Met 0 μMSAM vs. 10%Met 50 μM SAM ****p<0.0001). F. Quantitative western blotting of MAT2A, H3K36me3, and histone H3 in DIPG04 cells comparing 10% methionine media with 100% supplemented with 500 μM of SAM. G, H. Quantification of MAT2A and H3K36me3 using Li-Cor fluorescent system for DIPG04 cells comparing. 10% methionine media with 100% supplemented with 500uM of SAM. ***p<0.0001 Biological replicate of n=2, samples were repeatedly measured 3 times. ((G) (100%Met vs. 100%+SAM *p=0.0135), (100%Met vs. 10%Met *p=0.0479), and (100%Met vs. 10%Met+SAM p=0.7667). ((H) (100%Met vs. 100%+SAM p=0.7451), (100%Met vs. 10%Met ***p=0.0004), and (100%Met vs. 10%Met+SAM p=0.7897). I. Percent viable cell count of DIPG13P cells grown in media with 10% of normal methionine levels relative to control (100%) and supplemented with escalating concentrations of SAM. Adjusted P-values as follows: (10%Met 0 μMSAM vs. 10%Met 5 μM SAM p=0.1167), and (10%Met 0 μMSAM vs. 10%Met 50 μM SAM ****p<0.0001). J. Quantitative western blotting of MAT2A, H3K36me3 and histone H3 in DIPG13p cells comparing 10% methionine media with 100% supplemented with 500 μM of SAM. K, L. Quantification of MAT2A and H3K36me3 using Li-Cor fluorescent system for DIPG13p cells comparing 10% methionine media with 100% supplemented with 500 μM of SAM. ***p<0.0001 Biological replicate of n=3, samples were repeatedly measured 3 times. ((K) (100%Met vs. 100%+SAM ***p=0.0008), (100%Met vs. 10%Met **p=0.0015), and (100%Met vs. 10%Met+SAM *p=0.0242). ((L) (100%Met vs. 100%+SAM p=0.8428), (100%Met vs. 10%Met **p=0.0057), and (100%Met vs. 10%Met+SAM p=0.6469). ((A, E, I) Experiments performed were in biological triplicates. Statistical analysis performed as a one-way ANOVA followed by Šídák’s multiple comparisons test. Data displayed as mean ± s.e.m.). ((C-D, G-H,K-L) Statistical analysis performed as a two-tailed, unpaired T-test. Data displayed as mean ± s.e.m.).
