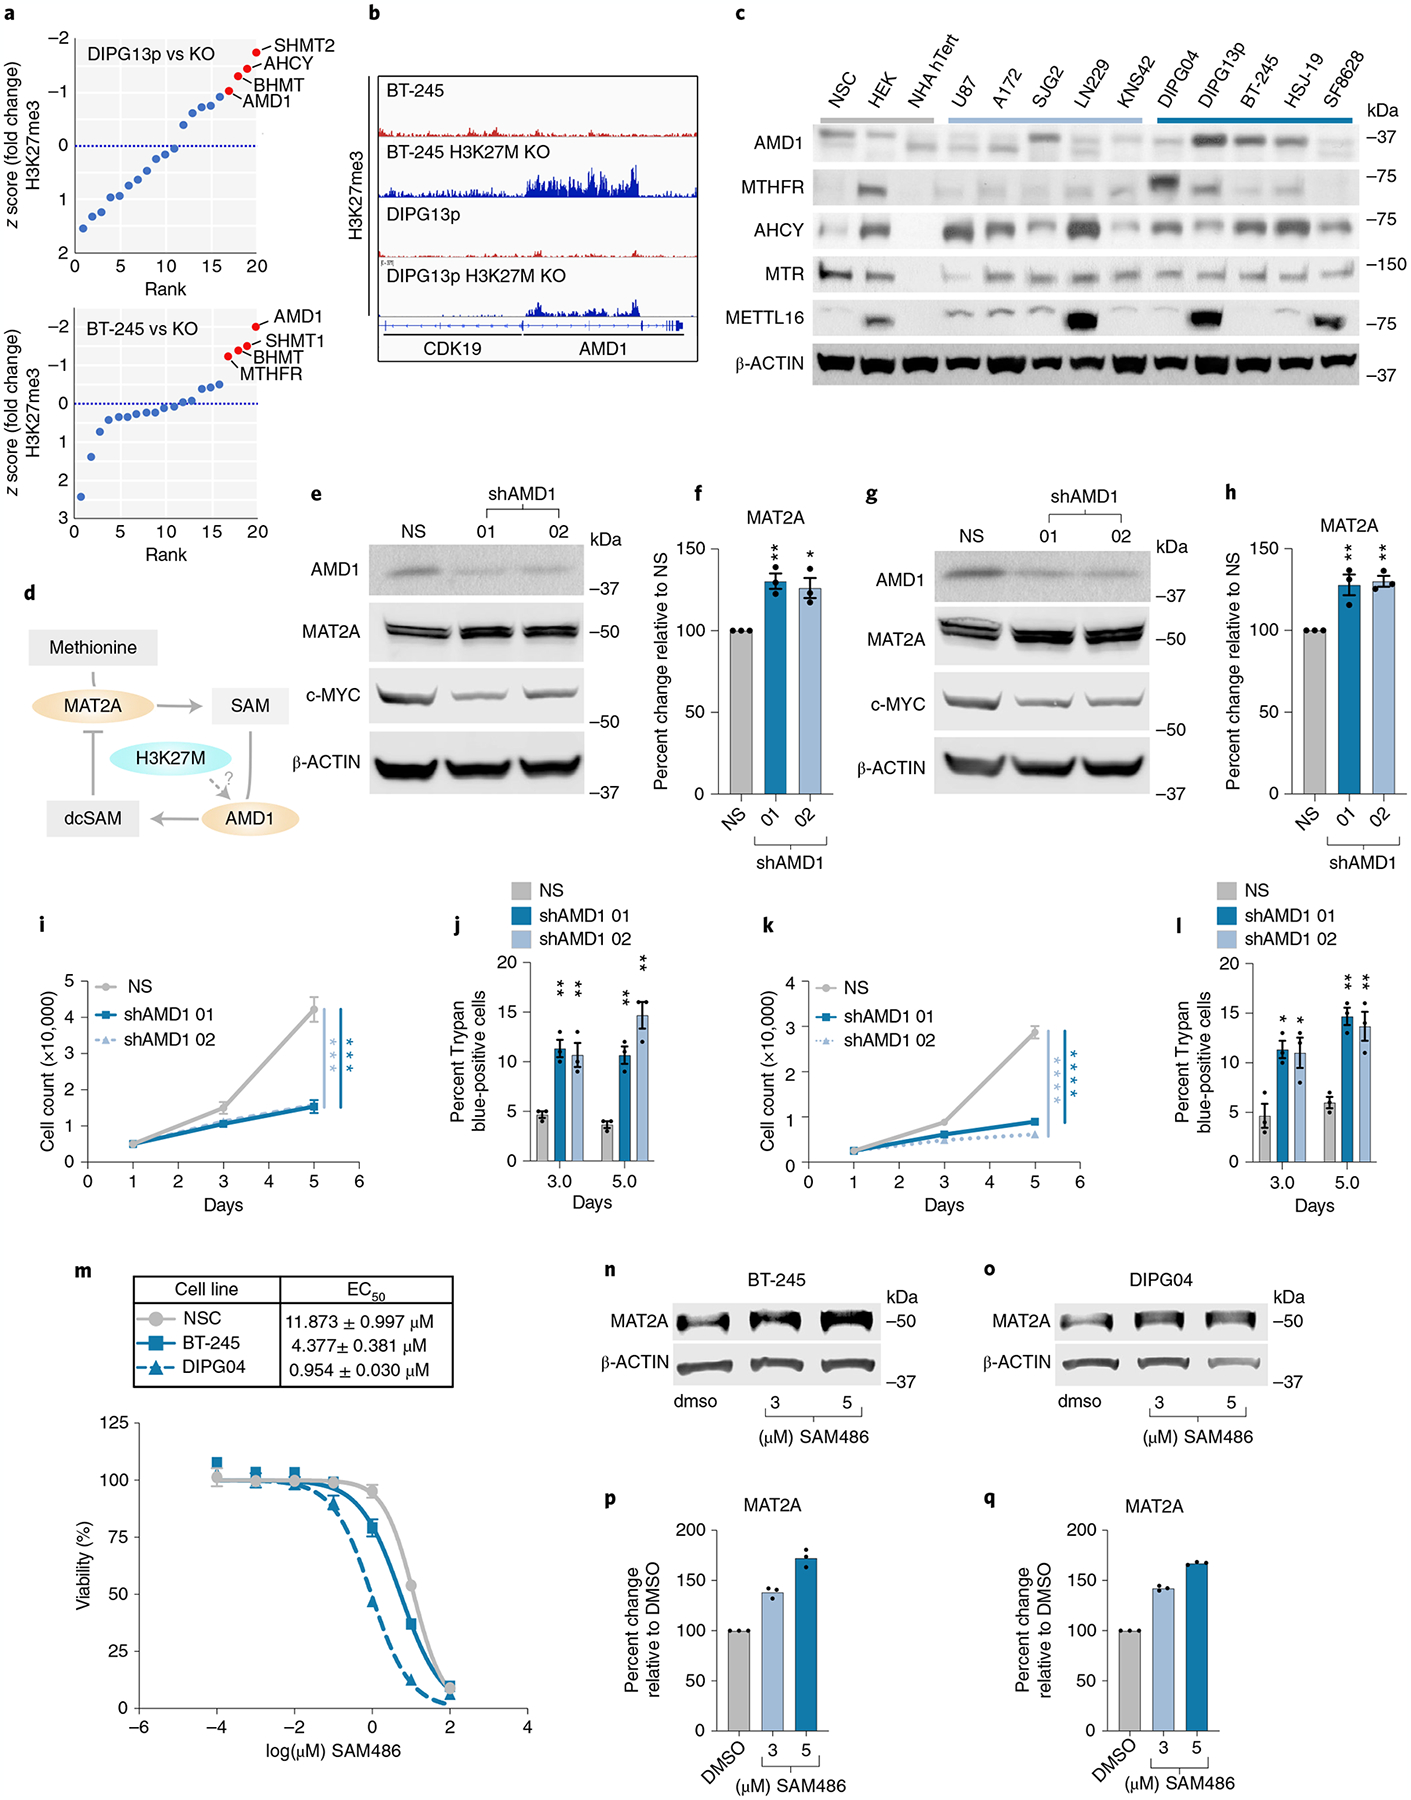
Fig. 6 |. AMD1 Downregulates MAT2a.

a, Distribution of z-scored H3K27me3 fold change in DMG cell lines versus isogenic CRISPR-corrected H3K27MKO, DIPG13p and BT-245. b, Integrated genomics viewer output of H3K27me3 ChIP-seq data at the AMD1 locus in H3K27M lines and isogenic lines with H3K27M KO. c, Western blotting of several components of methionine metabolism in DMG, PHGG, aGBM and control cells. d, Proposed hypothesis of MAT2A-reduced protein expression via AMD1 and dcSAM. e–h, Quantitative western blotting of MAT2A and C-MYC in AMD1 knockdown BT-245 (e) and DIPG04 (g). Quantification of MAT2A using Li-Cor fluorescent system in AMD1 knockdown (f) BT-245 and (h) DIPG04. n = 3 Biological replicates and samples were repeatedly measured three times. Statistical analysis was performed using a one-way analysis of variance (ANOVA) followed by a one-sided Tukey’s multiple comparison test. Data are displayed as mean ± s.e.m. (shAMD1_01 **Adjusted P = 0.0072, shAMD1_02 *Adjusted P = 0.0145) (f) and shAMD1_01 **Adjusted P = 0.0074, shAMD1_02 **Adjusted P = 0.0051 (h); adjusted P > 0.05 not displayed). i. Cell count in DMG lines BT-245 cells with AMD1 knockdown, days 1, 3 and 5. Experiments were performed in biological triplicate. Statistical analysis was performed on day 5 (NS versus shAMD1 01 ***P = 0.00028; and NS versus shAMD1 02 ***P = 0.000211). NS, non-silencing siRNA. j, Percentage of apoptotic cells in BT-245 cells lines with AMD1 knockdown, days 3 and 5. Experiments were performed in biological triplicate. Statistical analysis was performed at day 3 and 5 (shAMD1_01 day 3 **P = 0.002111, shAMD1_01 day 5 **P = 0.001757; and shAMD1_02 day 3 **P = 0.008581, shAMD1_02 day 5 **P = 0.001322). k, Cell count in DMG lines DIPG04 with AMD1 KD, days 3 and 5. Experiments were performed in biological triplicate. Statistical analysis was performed on day 5 (NS versus shAMD1 01 ****P = 0.000015; and NS versus shAMD1 02 ****P = 0.000009). l, Percentage of apoptotic cells in DIPG04 cells with AMD1 KD, days 3 and 5 (P < 0.001). Experiments were performed in biological triplicate. Statistical analysis was performed at day 3 and 5 (shAMD1_01 day 3 *P = 0.011056, day 5 **P = 0.001193; and shAMD1_02 day 3 *P = 0.031126, day 5 **P = 0.008023). *P < 0.05, **P < 0.01. m, Dose–response of DMG cells, BT-245, DIPG04 and NSC cells treated with AMD1 inhibitor. EC50 values in BT-245, DIPG04 and NSC (top). Experiments were performed in biological sextuplicate. Data are displayed as mean ± s.e.m. n,o, Quantitative western blotting of MAT2A with escalating doses of AMD1 inhibitor BT-245 (n) and DIPG04 (o). p,q, Quantification of MAT2A using Li-Cor fluorescent system in BT-245 (p) and DIPG04 (q) technical replicates of n = 3, samples were measured repeatedly three times. Statistical analysis was performed using a two-tailed, unpaired t-test (i–l). Data are displayed as mean ± s.e.m. DMSO, dimethylsulfoxide.
