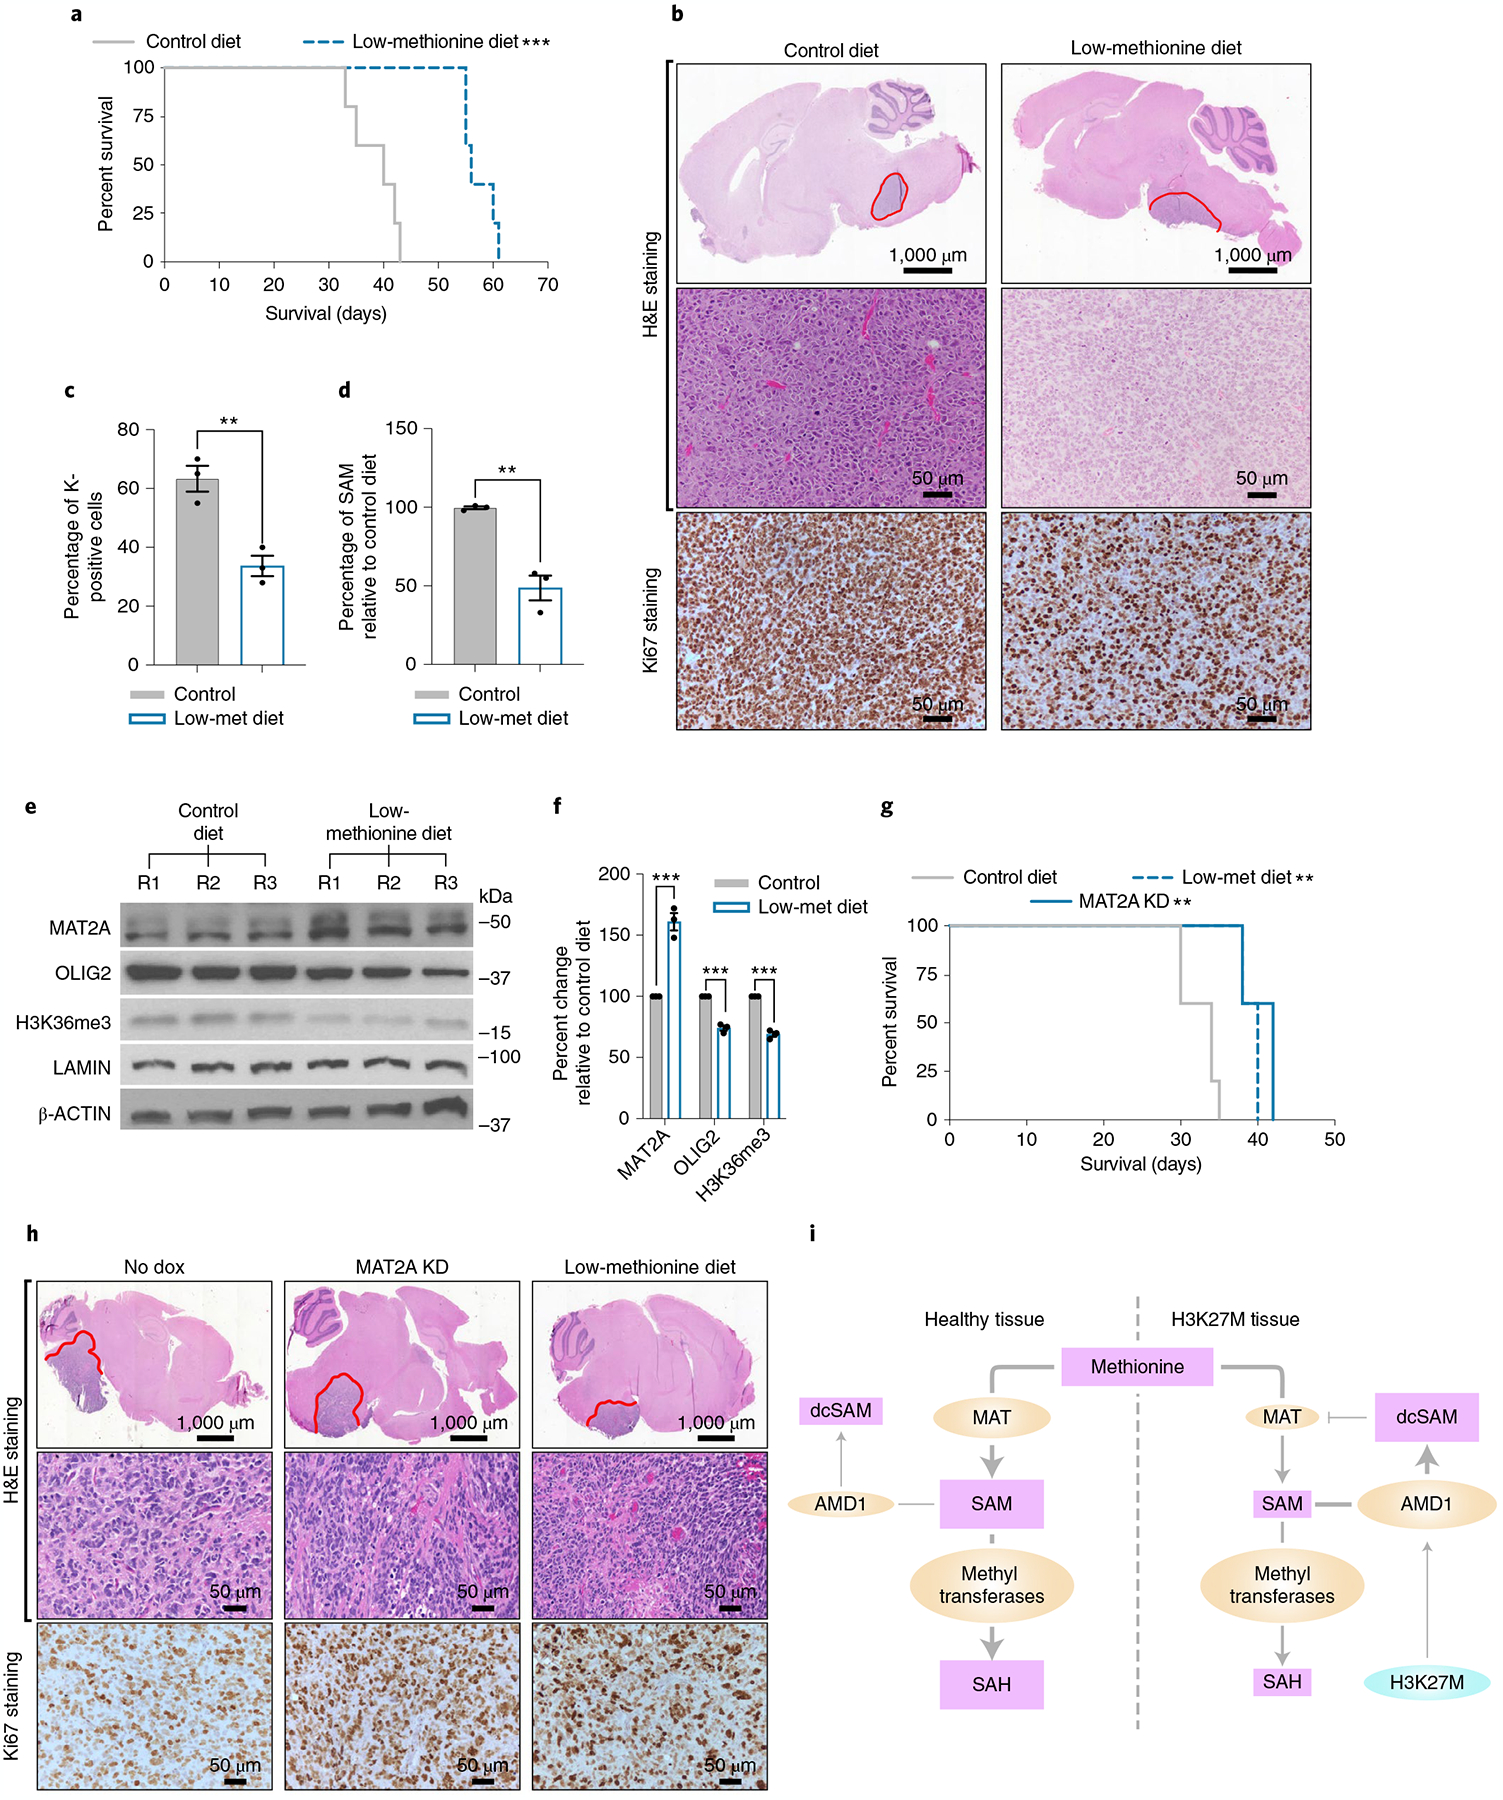
Fig. 8 |. MAT2A depletion or MR impedes DIPG growth in vivo.

a, Kaplan–Meier survival curve showing that MR increases survival of the H3K27MPP DMG model. Kaplan–Meier survival curve of H3K27MPP cells injected into the midbrain-pons of immunocompetent C57BL/6 mice. A log-rank Mantel–Cox test was performed between the groups with n = 7 mice per group (4 male and 3 female). ***P = 0.0003. A post hoc power estimation based on the sample size with a two-sided α of 0.05 provided a >0.99 power. b, H&E and Ki67 staining confirming high-grade glioma histology from H3K27MPP-injected mice. c, Ki67 quantification confirming loss of Ki67-positive cells from H3K27MPP tumors on low-methionine diet compared to control chow. Ki67 indices were calculated from three animals per group with each index being an average of five high-magnification field of views (control versus low-methionine diet **P = 0.003). d, Quantification of SAM concentrations in H3K27MPP tumors on a low-methionine diet compared to control chow (n = 3 tumors per group; control versus low-methionine diet **P = 0.0062). e. Western blotting of MAT2A, OLIG2, H3K36me3 and LAMIN in H3K27MPP tumors from control and low-methionine diets. f, Quantification of MAT2A and OLIG2 normalized to β-actin and H3K36me3 normalized to LAMIN from e from three independent western blots comparing H3K27MPP tumors on control diet versus a low-methionine diet (control versus MR MAT2A ***P = 0.000955; OLIG2 ***P = 0.000236; and H3K36me3 ***P = 0.000118). g, In vivo orthotopic DIPG13p xenograft with control, MAT2A knockdown (+ dox) or DIPG13p xenografts put on a low-methionine data. A log-rank Mantel–Cox test was performed between the groups with n = 5 mice per group (5 female) (control versus MAT2A knockdown **P = 0.0019) and (control versus low-methionine diet **P = 0.0019). A post hoc power estimation based on the sample size with a two-sided α of 0.05 provided: control versus MAT2A knockdown 0.995 power and control versus low methionine, 0.991 power. h. H&E and MAT2A immunohistochemistry (IHC). I. Proposed model of compromised MAT2A function in DIPG compared to healthy cells. Statistical analysis was performed using a two-tailed, unpaired t-test (c,d,f). Data are displayed as mean ± s.e.m.
