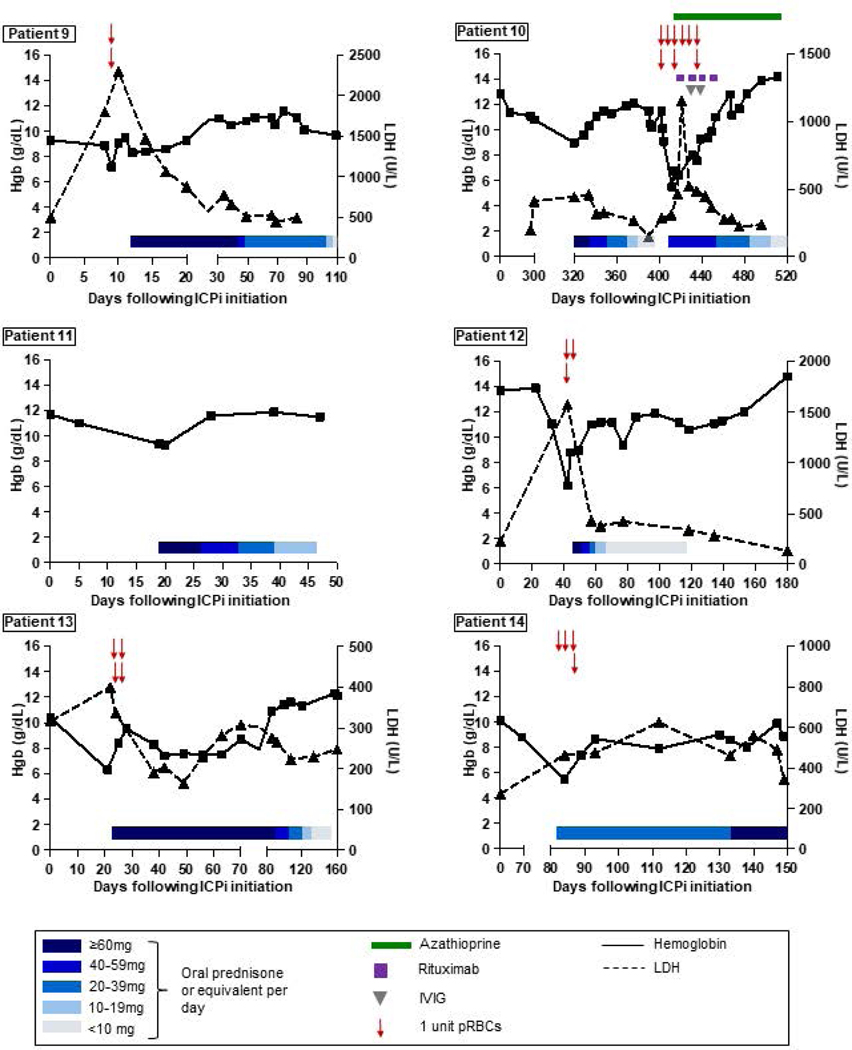
Figure 1. Hemoglobin and LDH trends, and response to treatment.
The X axes represent the number of days following initiation of ICPi therapy (with day 0 indicating the first day of ICPi administration). The Y axes on each graph represent hemoglobin (left) and LDH concentrations (right). Hemoglobin and LDH trends are depicted with solid and dashed lines, respectively. Blue rectangles indicate steroid tapers. Red arrows represent pRBC transfusions. Green rectangles represent azathioprine. Purple squares represent rituximab infusions. Gray triangles represent IVIG infusions. Abbreviations: ICPi, immune checkpoint inhibitor; IVIG, intravenous immune globulin; LDH, lactate dehydrogenase; pRBCs, packed red blood cells.


