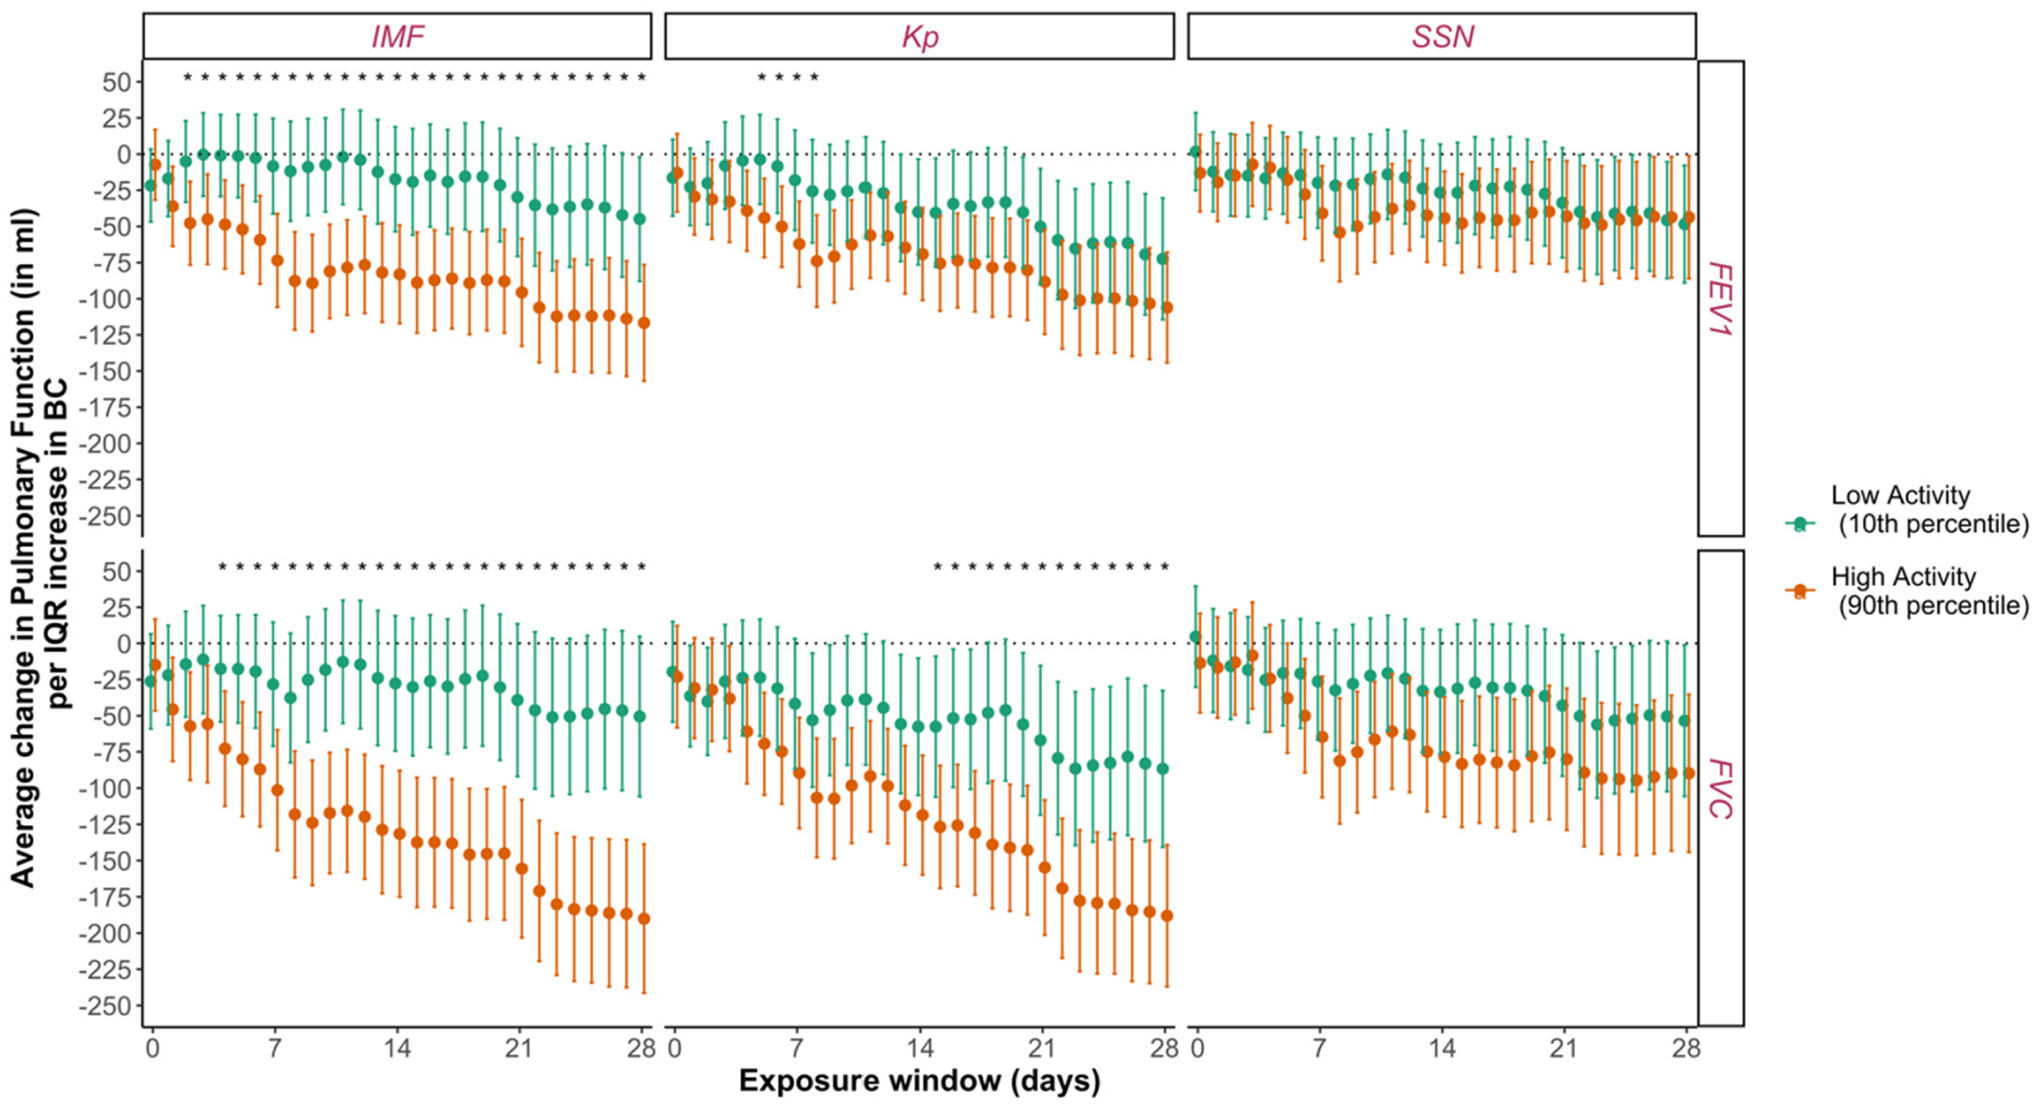
Fig. 5.

Association of exposure to black carbon (BC) with forced vital capacity (FVC) and forced expiratory volume at 1 s (FEV1) at high (90th percentile) and low (10th percentile) solar and geomagnetic activity periods. Note: Linear mixed effects models adjusted for age, height, race, selected medication, lifestyle factors (smoking, alcohol), day of the week, seasonality, and medical comorbidities, ambient temperature and relative humidity on the day of pulmonary function measurement (day 0) were used to estimate the association between exposure to black carbon and pulmonary function at 10th and 90th percentile of solar and geomagnetic activity parameters (n = 2075). Moving averages calculated starting on day 1 through day 28. Error bars represent the 95 % confidence intervals. Footnote: BC (black carbon); IMF (interplanetary magnetic field); Kp Index (planetary K index); SSN (sunspot number). Asterisks indicate the p-value for interaction term between air pollutant and solar activity parameters with “*” for significant at <0.05 level. 90th percentile and 10th percentile for day zero of all exposure variables are given in Table 2. The IQRs for BC are given in Supplementary Material Table S11. The figure is based on the values from Table S6, S8, and S10 in Supplementary material.
