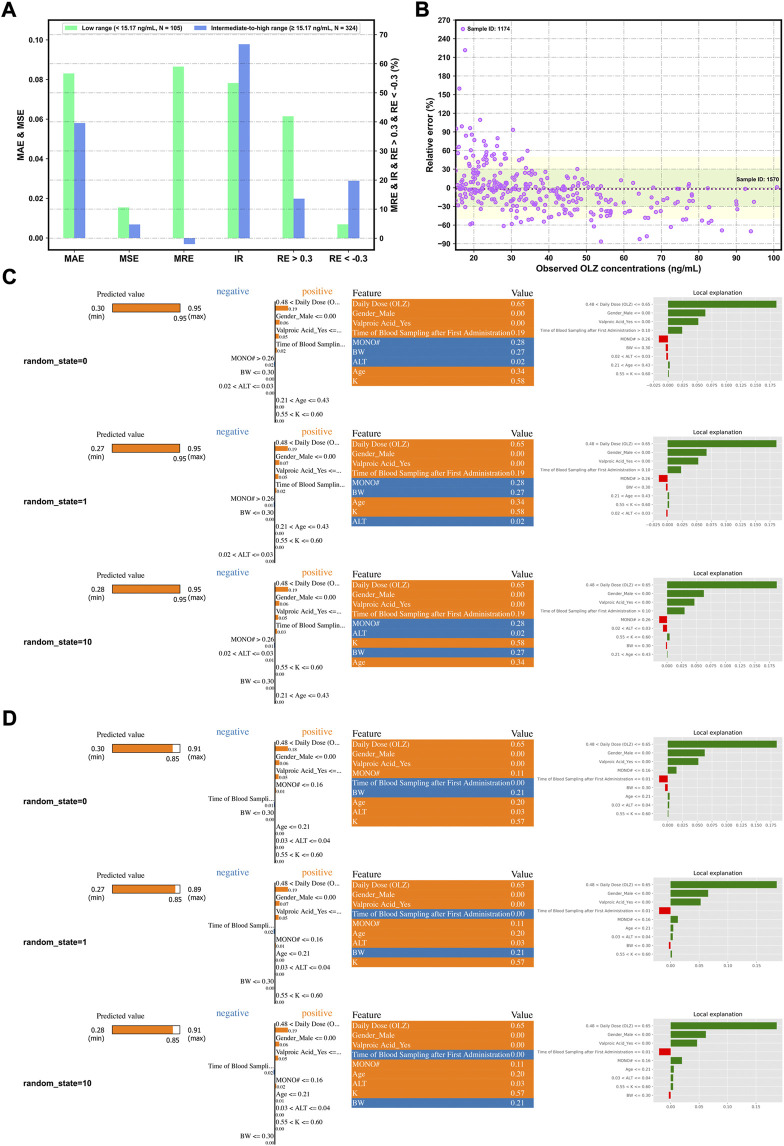
FIGURE 8.
Assessing the forecasting performance of the proposed stacking model in terms of different ranges of C (OLZ) on the validation cohort: Histograms of various metrics in the context of the low and intermediate-to-high ranges (A), and a scatterplot of the relative error (RE)% versus the observed C (OLZ) in the intermediate-to-high range (B), where the red dotted lines denote the MRE, the colored areas denote the ±30% (green color) and ± 50% (yellow color) ranges of the RE, and the dotes labeled by sample ID 1174 and ID 1570 represent the maximum RE of prediction and the maximum observed C (OLZ), respectively. Interpretation of the results of prediction of samples ID 1174 (C) and ID 1570 (D) by the LIME algorithm using different random_state values. The four views for each sample, from left to right, show the predicted values of the explanation and the stacking models, the feature coefficients (the orange and blue colors depict positive and negative relationships, respectively), the feature values in this sample, and the local explanation plot of these features.

