Table 2.
Molecular Docking results of monosodium glutamate (MSG) and the commercial inhibitors with the oxidative stress and hormonal-related proteins.
| Protein Name/Symbol | PDB IDa | MSG |
Commercial inhibitor |
||||||||
|---|---|---|---|---|---|---|---|---|---|---|---|
| 2D diagram of interaction | No of interacting residues | Affinityb | Kic | Inhibitor Name | PubChem ID | 2D diagram of interaction | No of interacting residues | Affinityb | Kic | ||
| Apoptosis regulator BAX (BAX) | 6EB6 |  |
8 | -4.6 | 415.9 | BAI1 | 2729027 |  |
2 | -6.4 | 20.21 |
| Bcl-2-related protein A1 (BCL2A1) | 5WHI |  |
6 | -4.8 | 315.3 | S55746 | 71654876 |  |
5 | -8.6 | 0.51 |
| Caspase 3 (CASP3) | 1NME |  |
2 | -4.5 | 471.6 | Ac-DEVD-CHO | 644345 |  |
8 | -6.1 | 36.57 |
| Caspase 7 (CASP7) | 4FDL |  |
4 | -4.5 | 468.7 | Ac-DEVD-CHO | 644345 |  |
8 | -6.2 | 28.51 |
| Caspase-8 (CASP8) | 1QTN |  |
6 | -4.7 | 340.8 | Ac-DEVD-CHO | 644345 |  |
3 | -9.4 | 0.13 |
| Caspase-9 (CASP9) | 1NW9 |  |
13 | -4.8 | 312.9 | Ac-DEVD-CHO | 644345 | 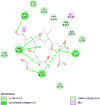 |
13 | -8.6 | 0.52 |
| Cytochrome C oxidase subunit 2 (MT-CO2) | 5Z62 |  |
14 | -5.6 | 75.6 | Indomethacin | 3715 |  |
18 | -8.2 | 0.93 |
| Glutamate dehydrogenase 1 (GLUD1) | 1L1F |  |
3 | -4.8 | 311.1 | (-)-Epigallocatechin Gallate | 65064 | 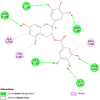 |
9 | -9.6 | 0.09 |
| Glutaminase (GLS) | 3CZD |  |
12 | -4.8 | 324.9 | BPTES | 3372016 |  |
20 | -7.7 | 2.11 |
| Human estrogens receptors alpha (ESR1) | 1ERE |  |
2 | -4.8 | 323.1 | AZD9496 | 11201035 |  |
6 | -7.4 | 3.53 |
| Human oestrogen receptor beta (ESR2) | 1U3Q |  |
15 | -5.2 | 151.0 | PHTPP | 11201035 | 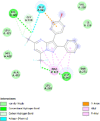 |
12 | -6.7 | 11.64 |
| Insulin like growth factor binding protein 1 (IGF1R) | 2DSQ | 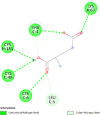 |
6 | -4.1 | 1012.7 | NVP-AEW541 | 11476171 |  |
8 | -7.5 | 2.97 |
| Macrophage migration inhibitory factor (MIF) | 1CA7 | 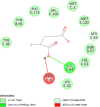 |
12 | -5.0 | 200.7 | ISO-1 | 4633677 | 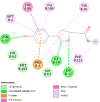 |
12 | -7.8 | 1.88 |
| Oxytocin receptor (OXTR) | 6TPK |  |
11 | -4.7 | 354.3 | L-371,257 | 6918320 |  |
25 | -9.9 | 0.05 |
| Phosphatidylinositol 4,5-bisphosphate 3-kinase catalytic subunit alpha isoform (PIK3CA) | 2AR5 |  |
7 | -5.0 | 202.8 | BAY1082439 | 135905473 |  |
8 | -6.9 | 9.38 |
| Progesterone receptors (PRGR) | 1A28 |  |
12 | -4.7 | 384.2 | Mifepristone | 55245 | 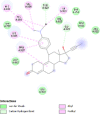 |
15 | -6.7 | 13.02 |
| Proline-rich AKT1 substrate 1 (AKT1S1) | 6NPZ |  |
15 | -5.4 | 106.0 | 3CAI | 152961 | 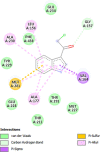 |
13 | -6.3 | 25.34 |
| Prostaglandin E synthase (PTGES) | 3DWW |  |
12 | -5.6 | 82.3 | beta-Boswellic acid | 168928 |  |
6 | -6.8 | 10.95 |
| Prostaglandin F synthase (PTGFR) | 2F38 | 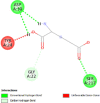 |
4 | -5.4 | 105.4 | N- (4-chlorobenzoyl)-melatonin | 86086004 | 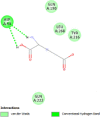 |
5 | -9.3 | 0.16 |
| Prostaglandin G/H synthase 2 (PTGS2) | 5IKR | 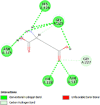 |
6 | -5.4 | 116.8 | TG4-155 | 5886965 | 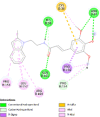 |
9 | -8.5 | 0.59 |
| Transforming protein RhoA (RhoA) | 1S1C | 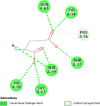 |
7 | -5.9 | 46.2 | Rhosin hydrochloride | 4304262 | 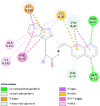 |
9 | -9.1 | 0.21 |
| Type-1 angiotensin II receptor (AGTR1) | 4YAY | 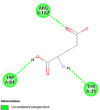 |
3 | -4.8 | 325.8 | Valsartan | 60846 | 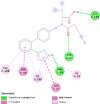 |
8 | -8.3 | 0.81 |
| Tyrosinase (TYR) | 5M8N | 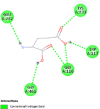 |
5 | -5.1 | 172.4 | Isobutylamido thiazolyl resorcinol | 71543007 |  |
6 | -7.4 | 3.91 |
Proteins data bank (https://www.rcsb.org/).
Binding Affinity (kcal/mol).
Inhibitor constant (μmol).
