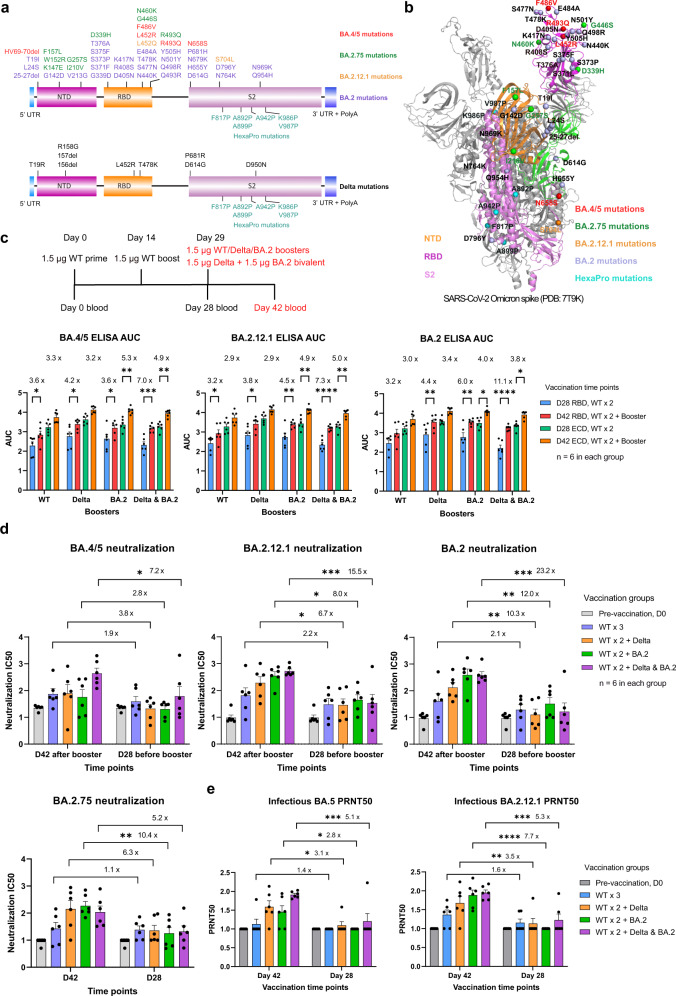
Fig. 1. Potent antibody response to Omicron BA.2, BA.2.12.1, BA.2.75, and BA.5 subvariants by Omicron BA.2 and Delta bivalent LNP-mRNA.
a Vaccine design of Omicron BA.2 and Delta variant-specific LNP-mRNA based on BA.2 and Delta spike mutations. Unique spike mutations on BA.2.12.1, BA.2.75, and BA.5 (not included in LNP-mRNA) are colored in orange, green, and red. b Distribution of BA.2 (purple), BA.2.12.1(orange), BA.2.75 (green), and BA.5 (red) mutations in one protomer of Omicron spike trimer (PDB: 7T9K). c Delta- and BA.2-specific monovalent or bivalent LNP-mRNA boosters improved antibody response of WT-vaccinated mice to Omicron BA.2, BA.2.12.1, and BA.4/5 subvariants. Comparison of binding antibody titers against BA.2, BA.2.12.1, and BA.4/5 spike RBD and ECD before (D28) and after (D42) receiving 1.5 µg WT-, Delta-, BA.2-specific monovalent or bivalent (1.5 µg Delta + 1.5 µg BA.2) LNP-mRNA boosters. Antibody titers were quantified by area under curves (AUC) of ELISA response curves in Supplementary Figs. S1 and S2. Blood samples were collected in mice immunized with two doses of 1.5 µg WT LNP-mRNA followed by 1.5 µg WT-, Delta-, BA.2-specific monovalent or Delta & BA.2 bivalent boosters (n = 6 in each group). d Neutralization of Omicron BA.2, BA.2.12.1, BA.2.75, and BA.5 pseudovirus by plasma of mice before (D28) and after (D42) vaccination with WT-, Delta-, BA.2-specific monovalent or Delta & BA.2 bivalent boosters. Six samples collected on day 0 were included and compared to both D28 and D42 datasets. e Neutralization of Omicron BA.2.12.1 and BA.5 authentic virus by plasma of mice before (D28) and after (D42) vaccination with WT-, Delta-, BA.2-specific monovalent or Delta & BA.2 bivalent boosters. Six samples collected on day 0 were included and compared to both D28 and D42 datasets. The authentic virus neutralization assay was blinded. Titer ratios before and after receiving boosters (D42/D28 ratios) were shown in Fig. 1c‒e. Titers in Fig. d, e are log10 transformed. Statistical analysis details can be found in supplementary methods.

