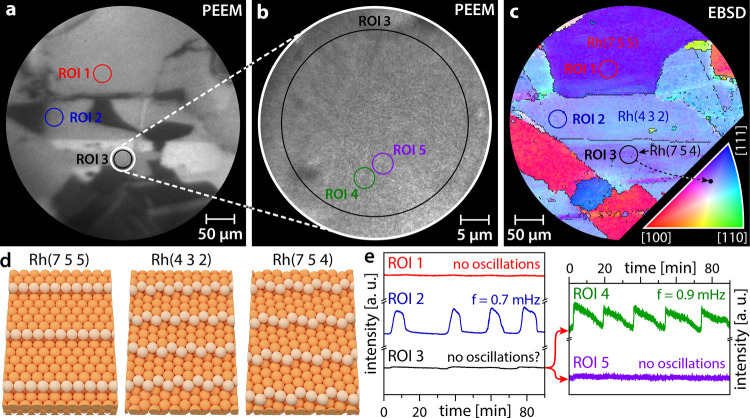
Figure 2.
PEEM zoom-in on catalytic H2 oxidation on a polycrystalline Rh foil at pH2 = 4.5 × 10⁻⁷ mbar, pO2 = 5.0 × 10⁻⁷ mbar, and T = 468 K: (a) PEEM snapshot taken during the ongoing reaction with three regions of interest (ROIs) marked; (b) electron-optical zoom-in (10-fold higher magnification) PEEM snapshot of the region marked by a white circle in panel (a); (c) EBSD map and crystallographic orientations (Miller indices) of the same region with the same ROIs as in panel (a); the legend for the color code is given as an inset in the lower right corner; (d) ball models of the Rh(7 5 5), Rh(4 3 2), and Rh(7 5 4) surfaces; and (e) time series of the local PEEM intensities obtained for the structurally different ROIs marked in panels (a) and (b).

