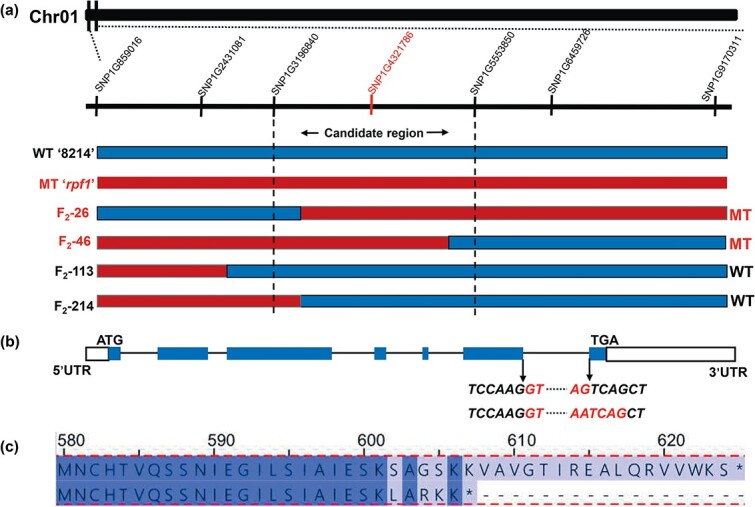
Figure 3.

Identification of the gene conferring the reduced pollen fertility phenotype. a Linkage analysis of the F2 population using KASP markers confirmed the causative SNP. The SNP marked with red is the only SNP co-segregating with the reduced pollen fertility phenotype. F2-26 and F2-42 had mutant phenotypes (marked with red). F2-113 and F2-214 had wild phenotypes (marked with black). b Structure of predicted CabHLH1 and the coding sequence alignment of CabHLH1 in ‘8214’ and rpf1. White boxes, blue box, and solid line represent 5′ and 3′UTR, exons, and introns, respectively. c Protein sequence alignment of CabHLH1 in ‘8214’ and rpf1.
