Figure 5.

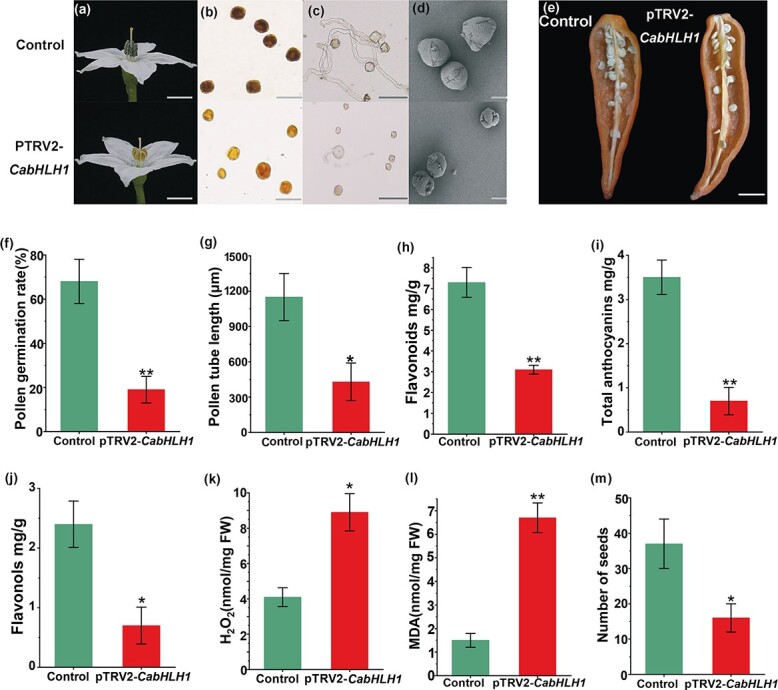
Phenotypes of control and pTRV2-CabHLH1 plants. a Flower phenotypes of control and pTRV2-CabHLH1 plants. Scale bars, 1 cm. b Pollen viability of control and pTRV2-CabHLH1 plants. Pollen grains in control plants were stained black by KI-I2. pTRV2-CabHLH1 plants were stained golden yellow. Scale bar, 100 μm. c Pollen grains of control and pTRV2-CabHLH1 plants were germinated in vitro. Scale bar, 100 μm. d SEM images of control and pTRV2-CabHLH1 pollen grains. Scale bar, 10 μm. e Seeds in control and pTRV2-CabHLH1 fruits. Scale bar, 1 cm. f Pollen germination rate. g Pollen-tube length. h Flavonoid content. i Total anthocyanin content. j Flavonol content. k H2O2 content. l MDA content. m Quantification of seed set. Error bars indicate mean ± standard error (n = 6) in f and g, mean ± standard error (n = 3) in h–l, and mean ± standard error (n = 20) in m. *P < .05, **P < .01.
