

Abstract
Intelligent computer-aided algorithms analyzing photographs of various mouth regions can help in reducing the high subjectivity in human assessment of oral lesions. Very often, in the images, a ruler is placed near a suspected lesion to indicate its location and as a physical size reference. In this paper, we compared two deep-learning networks: ResNeSt and ViT, to automatically identify ruler images. Even though the ImageNet 1K dataset contains a “ruler” class label, the pre-trained models showed low sensitivity. After fine-tuning with our data, the two networks achieved high performance on our test set as well as a hold-out test set from a different provider. Heatmaps generated using three saliency methods: GradCam and XRAI for ResNeSt model, and Attention Rollout for ViT model, demonstrate the effectiveness of our technique.
Clinical Relevance—
This is a pre-processing step in automated visual evaluation for oral cancer screening.
I. Introduction
According to American Cancer Society, the estimated numbers of new cases and deaths from oral cavity or oropharyngeal cancer in the United States for 2021 are about 54,010 and 10,850, respectively [1]. Worldwide, oral cancer is estimated to have 380,000 cases and cause 180,000 deaths annually. It is one of the most common cancers in Asia and the Pacific region [2]. Risk factors include heavy tobacco use, betel quid chewing, and alcohol consumption. Screening and detecting precancerous or cancerous lesions early play an important role in the reduction of the mortality and morbidity rates. Visual examination of the mouth is the most common first step in screening. After examination, care-providers may do biopsy on suspected lesions to confirm the disease. However, it has been observed that identifying oral cancer and precancer based on visual inspection requires considerable experience and training, and predictions from visual inspection may have large inter- and intra-observer variance among care-providers [3].
Aiming to tackle the challenges and help care-providers, computer-aided screening using image processing and machine learning techniques to analyze the pictures of mouth has been proposed [4–6]. However, there is very limited literature on this subject underscoring the need to make advances. One big challenge in automated visual evaluation (AVE) for oral cancer screening is the scarcity of data. The National Cancer Institute (NCI) at the National Institutes of Health (NIH) has initiated a multi-year study focused on further elucidating the natural history of oral cavity cancers through collaborations with several organizations including several hospitals in Taiwan (Local Institutional Review Boards (IRB) at the National Taiwan University, Chang Gung Memorial Hospital, and China Medical University Hospital approved the study protocol and informed consent. NIH does not have direct participant contact. Therefore, per the Common Rule, it is exempt from IRB.). In this study, patients with clinical precursors will be followed-up every 6 months for a period of 5 years, while controls and invasive cancer cases will have only one visit. For each patient, at each visit, pictures of different anatomical sites, viz., the right buccal mucosa, the left buccal mucosa, the top of the mouth, the dorsal tongue, the ventral tongue, and the floor of the mouth, are taken. A ruler is often placed near a lesion to indicate its location and provide a physical size reference.
Our ultimate goal is to develop an AVE algorithm to extract, identify, and grade lesions of oral precancer and cancer. To this end, there are several pre-processing steps that need to be done prior to classification and grading. We have already developed an algorithm to automatically label an image with one of the six categories of anatomical sites [7]. In this paper, we report our work on another pre-processing step: ruler image extraction. There are no manual markings on the lesion regions in the dataset. Existence of a ruler in the image can be considered as a weak annotation for indicating where a lesion is approximately located. Further, it also indicates that the image contains at least one lesion. Using the results of ruler image extraction, we can compare the performance of lesion detection or lesion image extraction algorithm trained with or without including images containing a ruler and examine the lesion image classifier’s performance on ruler images versus non-ruler images that contain a lesion.
Separating ruler images from non-ruler images superficially appears to be an easy task. However, when we tested the classification model (such as ResNet50) that was trained with the ImageNet dataset whose 1K classes contain a class labeled as “ruler, rule” on our dataset, the classifier missed a large number of ruler images (sensitivity is only 0.33). As a result, we decided to train and fine-tune a model using our dataset. Specifically, we applied and compared two classification networks: ResNeSt [8] and ViT [9]. Both models achieved very high performance on the test set. In addition, we used three saliency methods: GradCam [10] and XRAI [11] for ResNeSt model, and attention rollout [12] for ViT model to verify and examine which region in the image contributes the most to the prediction the model made. We compared the heatmaps of three saliency methods for both correctly and incorrectly classified images in the test set. Based on the observations on the heatmaps, we do not think a ruler region extracted based on thresholding heatmaps would be sufficient for our application, although they can highlight the ruler area. We plan to develop a ruler segmentation algorithm which requires collecting manual lineation of rulers in images as a future next task. We also ran the models on an additional large hold-out dataset batch collected from a different provider and discussed the results.
II. Methods
A. Dataset
In this work, we used two batches of images that we had received from the collaborating care-providers. The first batch contains images of 250 patients (2817 images) collected by one provider. The second batch of 168 patients (4331 images) was provided by another provider. In both batches, each patient has multiple images that were taken from different anatomical sites of the oral cavity during one or more visits. In addition to multi-field images, the study also collects other data including exfoliated cells, oral rinse, saliva, and venous blood. For patients with visible clinical precursor lesions, biopsies will be collected at annual study visit. If a lesion is identified, a picture with a ruler put next to the lesion is also captured besides a picture taken before the ruler is put. Figure 1 shows some images from a patient that had a lesion and Figure 1(c) is a ruler image. In the experiments, we labeled the batch that we received first and split it into three subsets, at patient level, to train, validate, and test the model. The second batch images were used as an additional hold-out test set.
Figure 1.

Example oral images (from one patient)
B. Classification Methods
Since ImageNet 1K classes contain a class called “ruler, rule” (class number: 769, and class ID: n04118776), we first evaluated the ResNet50 model trained on the ImageNet dataset on our dataset. If the classifier’s output for a test image is not class 769, then the image is classified as a non-ruler image. As shown later in Section 3, the ImageNet model misclassified a large percentage (about two thirds) of ruler images although it correctly classified all the non-ruler images. Therefore, we then used another two classification networks, ResNeSt and ViT, to train (fine-tune) and test on our dataset.
ResNeSt is a variant of ResNet that was proposed in [8] and has been demonstrated to achieve state-of-the-art performance with lower computation cost. It includes a new block module named “split attention” block. Specifically, in each block, feature maps are first divided into several “cardinal groups”. Then, the feature maps in each cardinal group are separated channel-wise into subgroups (“splits”). The features across subgroup splits are combined (“attention”) before being concatenated for all the groups. ResNeSt also applies network tweaks and several training strategies (such as augmentation, label smoothing, drop-out regularization, and batch normalization) to improve its performance. For our application, we used the weighted cross entropy loss function to deal with the dataset imbalance. We also applied more ways to augment the data. ResNeSt, like most of the existing image classification networks, belongs to the big family of convolutional neural networks (CNNs).
ViT [9], unlike CNN-based classification networks, was developed based on the Transformer [13] architecture originally designed for natural language processing tasks. It converts an image into an 1D sequence which is then processed by the Transformer network. Specifically, it divides an image into patches, creates linear embeddings from those patches, adds positional embeddings, inputs them into a standard transformer encoder, and uses multi-layer perceptron (MLP) head on top of the transformer encoder for class output. To fine-tune the ViT on our dataset, we simply replaced the last linear layer of MLP with a linear layer that has two outputs. We used the same augmentation methods as for ResNeSt. Other detailed implementation information is provided in Section 3.
C. Saliency Map Generation Methods
To examine which region in the image contributes the most to the prediction of the network and verify the network learns from the right information, we used and compared three saliency methods to get insights from the network learning and prediction: GradCam, XRAI, and Attention Rollout. GradCam [10] is an improvement and generalization of CAM [14] and it uses the gradient information flowing into the last convolutional layer of the CNN to indicate the neuron importance to the model’s decision. It can be applied to a large range of CNN architectures without the need to modify the architectures and retrain the models. XRAI [11] is a region-based saliency method that is based on an improved version of Integrated Gradient [15]. It first segments the image into many overlapping regions of different shapes and sizes, and then selects and combines regions based on the rank order of their integrated gradient attributions. Attention rollout was proposed by [12] to generate attention maps for the explanation of Transformer. It combines attention weights of all layers recursively and at each layer, the attention is averaged over all heads. In our experiments, we used GradCam and XRAI for the ResNeSt predictions and attention rollout for the ViT results.
III. Experimental Results And Discussions
We labeled the first batch of dataset we received that contains 250 patients with respect to containing a ruler or not. We divided this batch of dataset into training, validation, and test set at patient level (with 180, 20, and 50 patients, respectively). Table I lists the number of images of each category in each set. As shown in Table I, the dataset is significantly unbalanced as there is about five times number of non-ruler images than ruler images.
Table 1.
Number of images in each set
| Set | Ruler Images | Non-ruler Images |
|---|---|---|
| Train set | 308 | 1709 |
| Validation set | 41 | 206 |
| Test set | 91 | 462 |
For all the classifiers, the images were resized to be 224 × 224. We ran the ImageNet ResNet50 model on the test set first and its classification performance is listed in Table II. Although ImageNet ResNet50 model achieved high specificity and precision (both being 1.0), it got very low sensitivity (0.33) and F1 (0.496). As the confusion matrix in Table III shows, it misclassified most ruler images (61 out of 91) although it correctly identified all the non-ruler images. The ImageNet ResNet50 model obtained a reasonably good accuracy (0.890) because the dataset is unbalanced and there are a lot more of non-ruler images.
Table II.
Classification performance on test set
| Sens. | Spec. | Prec. | F1 | Acc. | |
|---|---|---|---|---|---|
| ImageNet | 0.330 | 1.000 | 1.000 | 0.496 | 0.890 |
| ResNeSt | 1.000 | 0.996 | 0.979 | 0.989 | 0.996 |
| ViT | 1.000 | 0.998 | 0.989 | 0.995 | 0.998 |
Table III.
Confusion matrix on test set (R:ruler, N: non-ruler)
| ImageNet | ResNeSt | ViT | ||||||
|---|---|---|---|---|---|---|---|---|
| GT→ | R | N | GT→ | R | N | GT→ | R | N |
| R | 30 | 0 | R | 91 | 2 | R | 91 | 1 |
| N | 61 | 462 | N | 0 | 460 | N | 0 | 461 |
For the ResNeSt model, we used ResNet50 as the base network. To deal with the data imbalance, we used the binary cross entropy loss that was weighted by the class weight (the total number of images divided by (2 × the number of non-ruler/ruler images)). The augmentation methods we used include random resized crop, random rotation, color jittering, random horizontal/vertical flip, and center crop. It is worth noting that since most of the rulers in the training images are located approximately horizontally, we found having a large range of random rotation (0~90°) is helpful. The batch size was 64. The optimizer was Adam (β1 = 0.9, β2 = 0.999) with a learning rate of 5×10⁻⁴. The model was trained for 100 epochs and the model at the epoch with the lowest loss value on the validation set was selected. For the ViT model, we used the ViT-Base with a 16×16 input patch size. To fine-tune the model, the SGD optimizer with a learning rate of 0.003 and mixed-precision were used. The batch size was 64 and we used the same augmentation methods as those for the ResNeSt model. The model was trained for 500 steps with cosine learning rate decay. All the experiments were conducted on a Lambda GPU server (GPUs: NVIDIA GeForce RTX 2080 Ti).
As shown in Table II, both ResNeSt and ViT models achieved very high classification performance, for example, the sensitivity increased from 0.33 to 1.00 compared to ImageNet model, while the specificity remained similarly high. The confusion matrixes in Table III show that both models identified all ruler images correctly and misclassified only one or two non-ruler images respectively.
To get explanation and insights on the predictions by the models, for the test set images, we generated heatmaps of GradCam and XRAI for the ResNeSt model and heatmaps of attention rollout for the ViT model. As shown in Figure 2, in general, the area of the ruler is highlighted in all three heatmaps of the ruler images (all are correctly classified). But among them, GradCam heatmaps are cleaner, smoother, and concentrate mainly on the ruler, while XRAI and attention rollout heatmaps are more spread and may also highlight non-ruler areas. Compared to GradCam and attention rollout, an XRAI heatmap is slower to generate as it contains a step of region over-segmentation which requires more computation. Figure 3 shows the three heatmaps of several non-ruler images that are correctly classified. The highlighted areas in those images do not appear to be at any specific places, which seems understandable given there is no general region of interest for a non-ruler image for this classification task. Figure 4 shows the heatmaps of the two misclassified images (non-ruler images predicted as ruler images) by ResNeSt model (ViT model misclassified only the first image). In [11], XRAI generated tighter object boundaries with suitable threshold than GradCam for the datasets they worked on. However, for our dataset and application, we observed that GradCam heatmaps are consistently cleaner and the highlighted area is more focused. We also observed attention rollout heatmaps may highlight areas along the borders of the image, like those in Figure 3. In addition, although the saliency heatmaps provide a reasonable explanation and can highlight the ruler object area, we do not think their localization results obtained after applying thresholding would be satisfactory for our application if using them as a ruler localizer, and we need to develop a ruler segmentation algorithm in the future.
Figure 2.
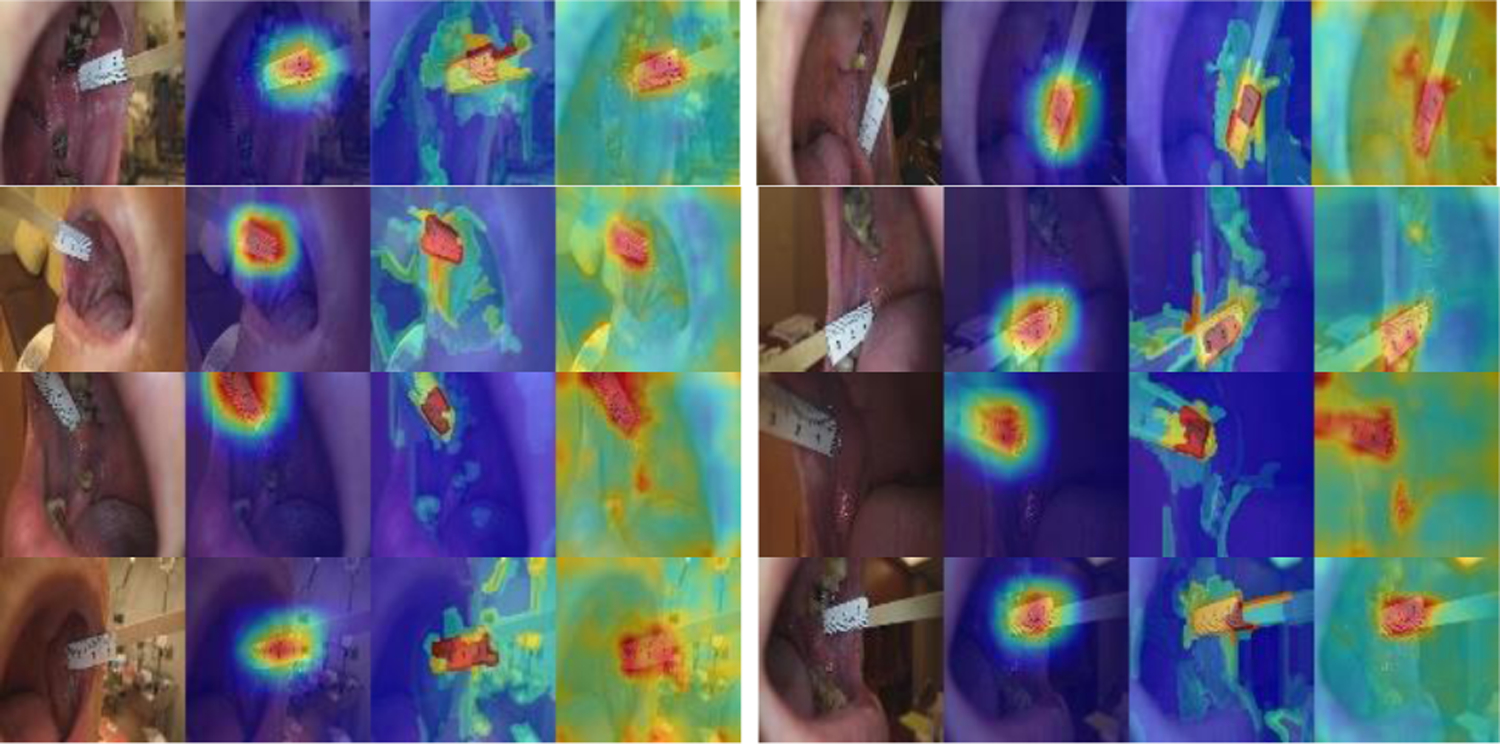
Heatmaps of correctly classified ruler images (GradCAM, XRAI, attention rollout).
Figure 3.
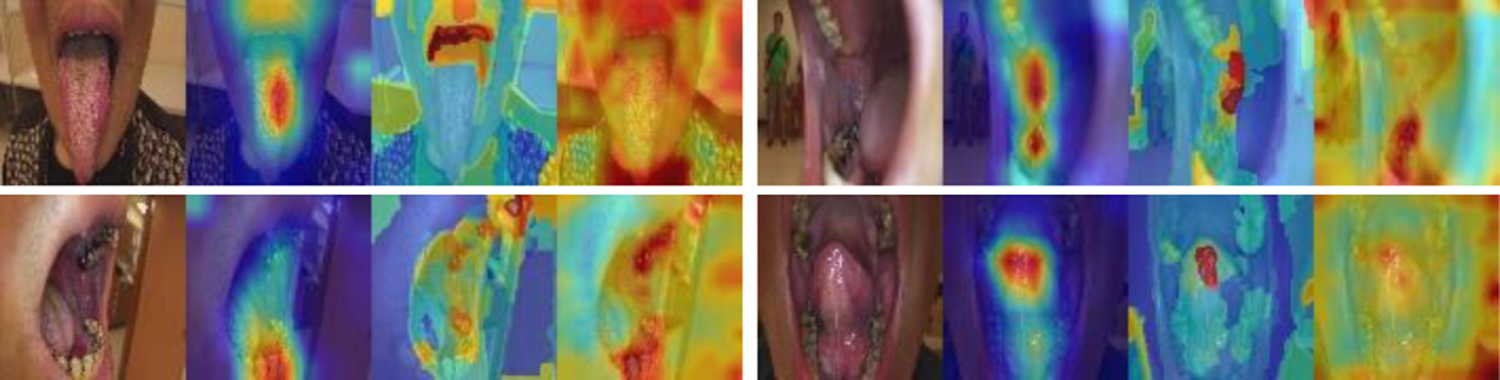
Heatmaps of correctly classified non-ruler images (GradCAM, XRAI, attention rollout).
Figure 4.
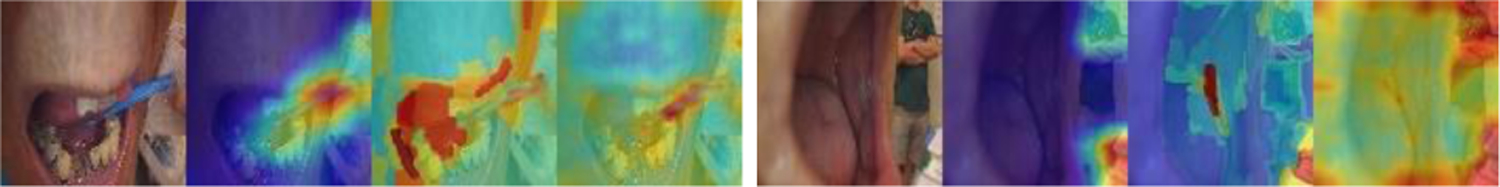
Heatmaps of misclassified images by ResNeSt (GradCAM, XRAI, attention rollout).
In addition to the test set in the batch of 250 patients, we tested both models on the second batch of dataset that was provided by a different provider. The second batch contains 4331 images of 168 patients. As the confusion matrix listed in Table IV, both models achieve 100% sensitivity. However, among the images that were predicted as ruler images by the models, some contains non-ruler sticks (such as cotton swabs and wood sticks) instead, and ViT model classified more of them as ruler images compared to ResNeSt model (specificity: 96.3% vs 98.2%). Figure 5 shows several examples of non-ruler stick images that were classified as ruler images: the first row is from the results of ResNeSt model (GradCam heatmaps), and the second row is from the results of ViT model (attention rollout heatmaps). After observing this issue, we went back to check the images of the first batch. There are only 6 such images in the first batch of 2817 images: two contain a wood stick, four contain a cotton swab. Four are in the training set (three as ruler image and one as non-ruler image) and two are in the validation set (one as ruler image and the other as non-ruler image). We will retrain a new model in the future with more such non-ruler stick images added to the training and validation sets, after 1) getting confirmation on whether they were put there just for the ease of capturing a picture regardless there was a lesion or not or they might be used to replace ruler in certain occasions; and 2) making decision on whether they should be considered as an individual class. It is worth to note that the rulers in the second batch images are not the same types of rulers (either having no digits or having different digits on it).
Table IV.
Classification results on the hold-out test set
| ResNeSt | ViT | ||||
|---|---|---|---|---|---|
| GT→ | R | N | GT→ | R | N |
| R | 548 | 69 | R | 548 | 142 |
| N | 0 | 3714 | N | 0 | 3641 |
Figure 5.
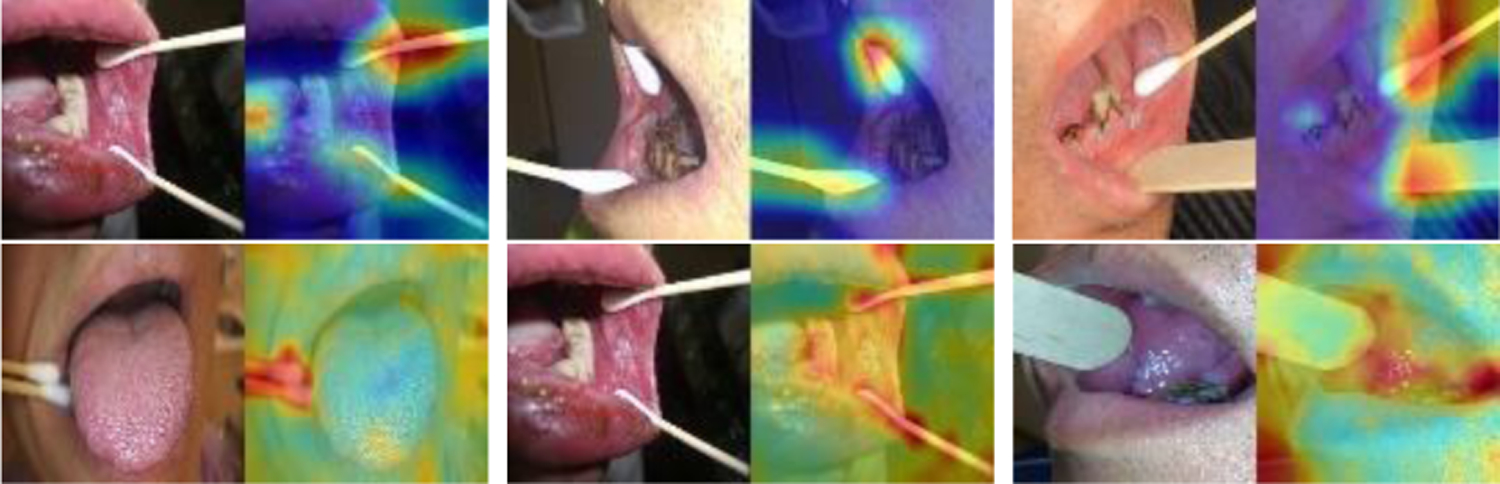
Images containing non-ruler sticks in an additional hold-out test set predicted as ruler images.
IV. Conclusions
During data collection, if a patient had a lesion, pictures of the patient’s mouth before and after a ruler was put next to the lesion to indicate the size and location of a lesion were collected. The step of ruler image extraction is helpful for the analysis and development of other system modules, such as lesion image classification. To extract ruler images, we applied and compared two classification networks after failed to obtain satisfactory results by simply using the ImageNet 1K classifier whose class labels contain a class of “ruler”. One is CNN based: ResNeSt, and the other is transformer based: ViT. We obtained very high performance after fine-tuning those two networks on our dataset. Moreover, we examined the results of three saliency methods: GradCam, XRAI, and attention rollout, to verify that the network predictions are not based on unreasonable/unrelated information in the images. Future work includes retraining the models with images that are not represented in the training set based on the results from the test on an additional hold-out second batch of received data collected by another provider, improving the saliency method used for ViT model, and working on ruler segmentation.
Acknowledgments
This research was supported by the Intramural Research Program of the National Library of Medicine (NLM) and the National Cancer Institute (NCI) both part of the National Institutes of Health (NIH). The authors want to thank Sandeep Angara at the NLM for his valuable help and discussion on software programming.
Contributor Information
Zhiyun Xue, National Library of Medicine, NIH, USA.
Kelly Yu, National Cancer Institute, NIH, USA.
Paul C. Pearlman, National Cancer Institute, NIH, USA
Anabik Pal, National Library of Medicine, NIH, USA and now is with SRM University, AP, India.
Tseng-Cheng Chen, National Taiwan University Hospital, Taipei, Taiwan.
Chun-Hung Hua, China Medical University Hospital, Taichung, Taiwan.
Chung Jan Kang, Chang Gung Memorial Hospital, Linkou, Taiwan.
Chih-Yen Chien, Chang Gung Memorial Hospital, Kaohsiung, Taiwan.
Ming-Hsui Tsai, China Medical University Hospital, Taichung, Taiwan.
Cheng-Ping Wang, National Taiwan University Hospital, Taipei, Taiwan.
Anil K. Chaturvedi, National Cancer Institute, NIH, USA
Sameer Antani, National Library of Medicine, NIH, USA.
References
- [1]. https://www.cancer.org/cancer/oral-cavity-and-oropharyngeal-cancer/about/key-statistics.html .
- [2]. https://www.who.int/news-room/fact-sheets/detail/oral-health .
- [3].Epstein JB, Güneri P, Boyacioglu H, and Abt E, “The Limitations Of the Clinical Oral Examination in Detecting Dysplastic Oral Lesions and Oral Squamous Cell Carcinoma,” J Am Dent Assoc, 2012. 143(12): p. 1332–42 [DOI] [PubMed] [Google Scholar]
- [4].Nishi Y, Horio K, Saito K, Habu M, and Tominaga K, “Discrimination of Oral Mucosal Disease Inspired by Diagnostic Process of Specialist,” Journal of Medical and Bioengineering, 2013. 2: p. 57–61. [Google Scholar]
- [5].Shamim MZM, Syed S, Shiblee M, Usman M, and Ali S, “Automated Detection of Oral Pre-Cancerous Tongue Lesions Using Deep Learning for Early Diagnosis of Oral Cavity Cancer,” The Computer Journal, 2020. [Google Scholar]
- [6].Fu Q, Chen Y, Li Z, Jing Q, Hu C, Liu H, Bao J, et al. “A Deep Learning Algorithm For Detection Of Oral Cavity Squamous Cell Carcinoma From Photographic Images: A Retrospective Study,” EClinicalMedicine, 2020. 27: p. 100558A. [DOI] [PMC free article] [PubMed] [Google Scholar]
- [7].Xue Z, Pearlman PC, Yu K, Pal A, Chen TC, Hua CH, Kang CJ, Chien CY, Tsai MH, Wang CP, Chaturvedi AK, and Antani S, “Oral Cavity Anatomical Site Image Classification and Analysis,” submitted to SPIE Medical Imaging, San Diego, USA, 2022. [DOI] [PMC free article] [PubMed] [Google Scholar]
- [8].Zhang H, Wu C, Zhang Z, Zhu Y, Zhang Z, Lin H, Sun Y, He T, Muller J, Manmatha R, Li M, and Smola A, “ResNeSt: Split-Attention Networks,” https://arxiv.org/abs/2004.08955
- [9].Dosovitskiy A, Beyer L, Kolesnikov A, Weissenborn D, Zhai X, et al. , “An Image is Worth 16×16 Words: Transformers for Image Recognition at Scale”, 2020. https://arxiv.org/abs/2010.11929
- [10].Selvaraju RR, Cogswell M, Das A, Vedantam R, Parikh D, Batra D, “Grad-cam: Visual Explanations From Deep Networks Via Gradient-Based Localization,” Proceedings of the IEEE International Conference on Computer Vision, 618–626, 2017. [Google Scholar]
- [11].Kapishnikov A, Bolukbasi T, Víegas F, Terry M,“XRAI Better Attributions Through Regions,” Proceedings of the IEEE International Conference on Computer Vision, 4948–4957, 2019. [Google Scholar]
- [12].Abnar S, and Zuidema W, “Quantifying Attention Flow In Transformers”, In ACL, 2020. [Google Scholar]
- [13].Vaswani A, Shazeer N, Parmar N, Uszkoreit J, Jones L, Gomez AN, Kaiser Ł, Polosukhin I, “Attention is All you Need”, Proceedings of the 31st International Conference on Neural Information Processing Systems (NIPS’17), Pages 6000–6010. [Google Scholar]
- [14].Zhou B, Khosla A, Lapedriza A, Oliva A, and Torralba A, “Learning Deep Features for Discriminative Localization,” Proceedings of the IEEE Conference on Computer Vision and Pattern Recognition, 2016. [Google Scholar]
- [15].Sundararajan M, Taly A, and Yan Q. “Axiomatic Attribution for Deep Networks”, Mar. 2017. arXiv: 1703.01365 [Google Scholar]