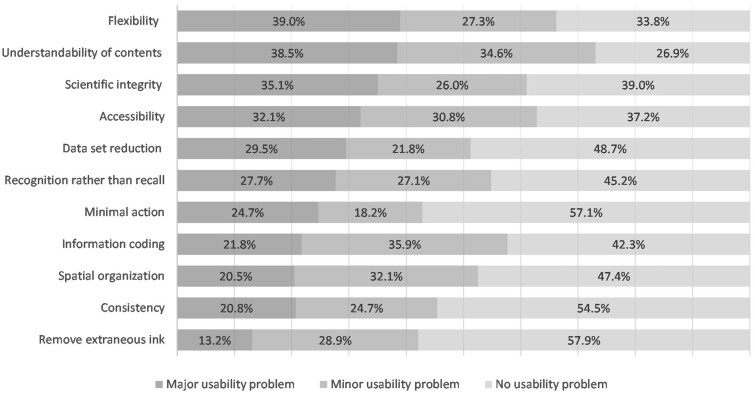
Figure 1.
Relative frequency of usability problems on sexually transmitted infections dashboards in the United States. Some problems are double-counted if mentioned by multiple evaluators. The percentages are calculated across 6 evaluators and 13 dashboards (maximum = 78). For example, 39% major usability problem for flexibility means that flexibility of dashboards had major usability problems in 30 out of 78 given scores.

