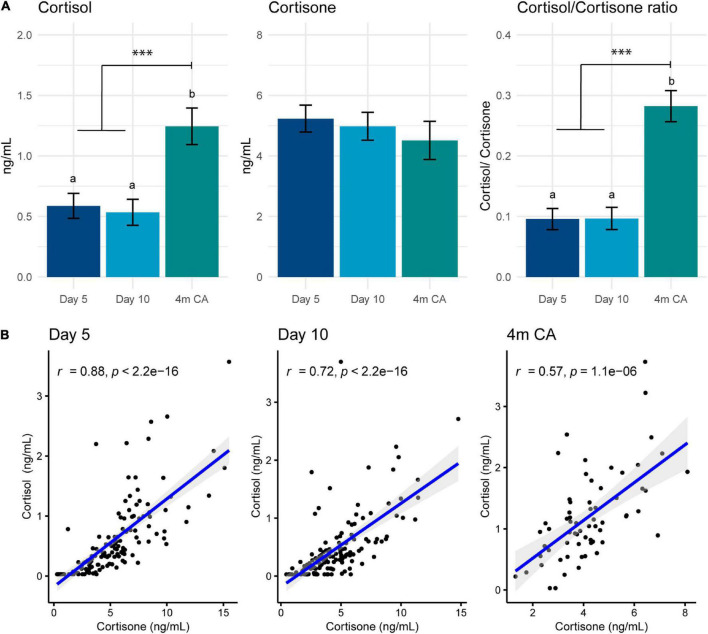
FIGURE 2.
(A) Human milk concentrations of cortisol, cortisone and the cortisol-to-cortisone ratio at different lactation stages. Data are mean and standard error. Statistically significant differences are represented by different letters above the bars. ***p < 0.001 (B) Correlations between cortisol and cortisone at different lactation stages: postnatal day 5 (left), day 10 (middle), and 4 months’ corrected age (right). Blue line represents Spearman correlation coefficient and shaded area the 95% confidence interval. 4m CA: 4 months’ corrected age.

