Figure 3.

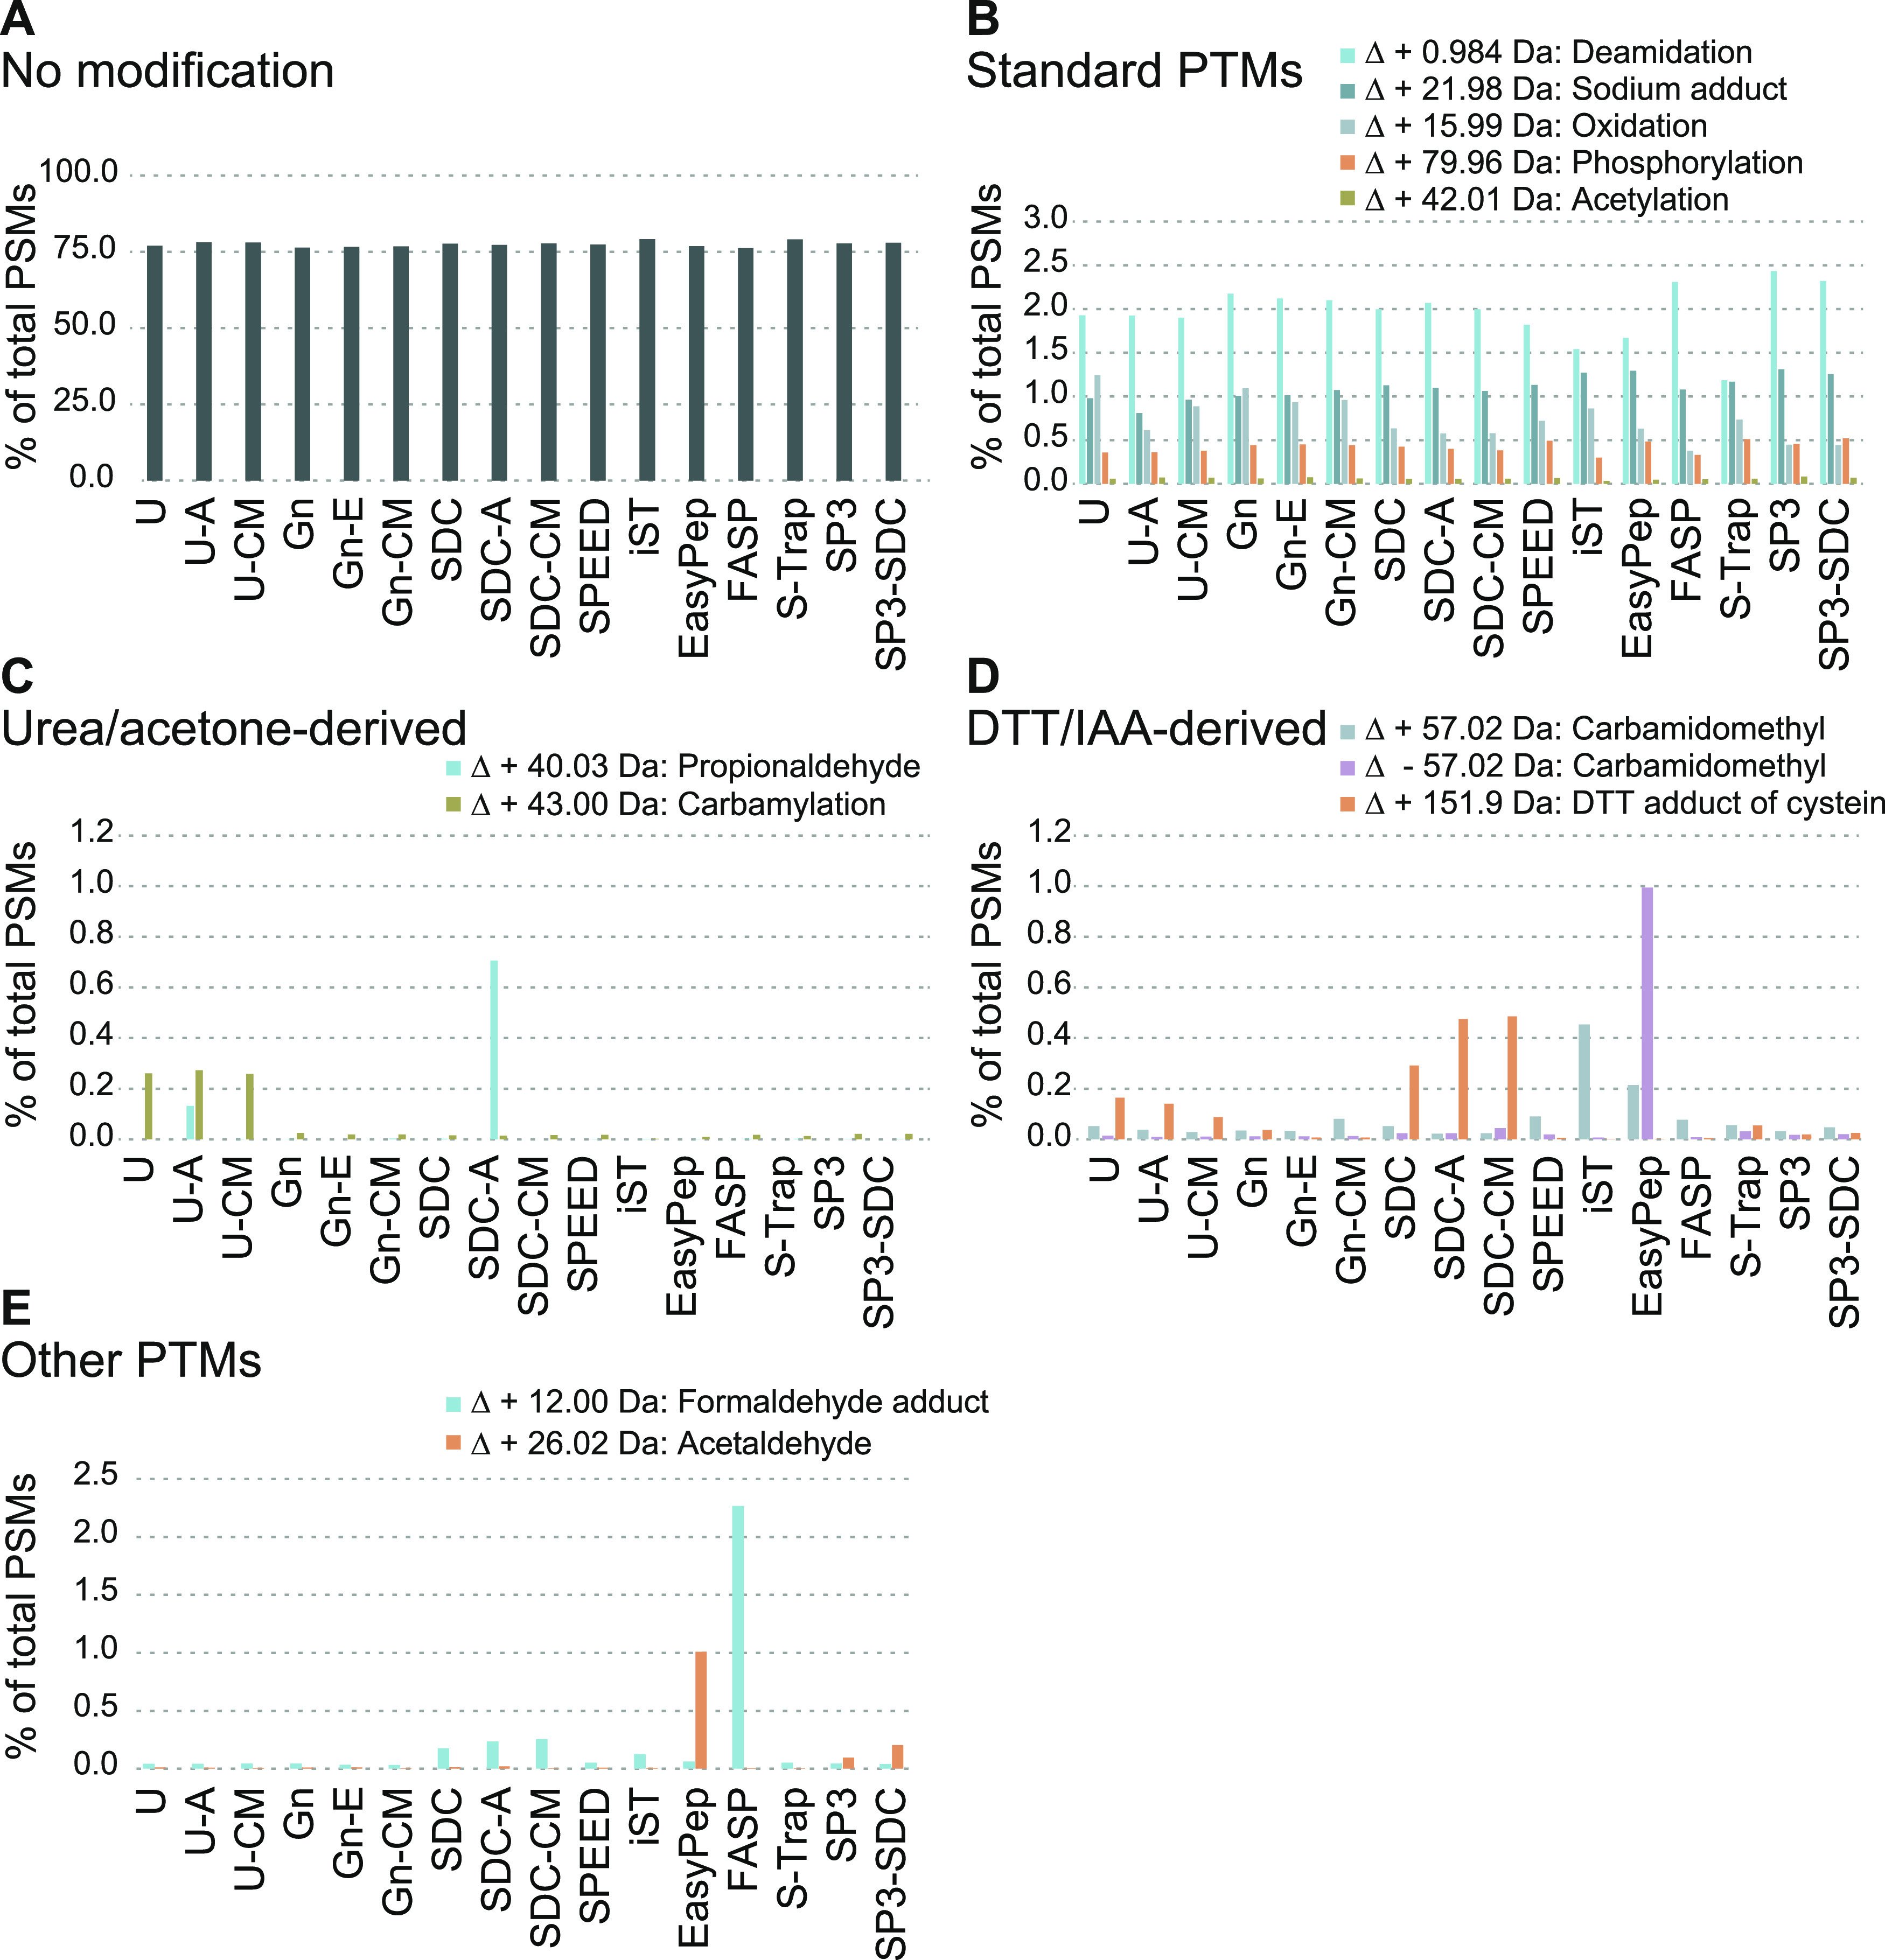
Analysis of covalent peptide modification artifacts created during sample preparation. Open search analysis using MSFragger to identify sample preparation-induced peptide modification artifacts. Bar plots show the sum of PSMs of three replicates in percent (see also Supplemental Table 2). (A) Bar plot showing the percentage (y-axis) of PSMs without modification. The x-axis lists the applied sample preparation protocols. (B) Similar to (A) except that exemplary PTMs are shown. Values for oxidation and acetylation represent modifications that were detected in addition to methionine oxidation or protein N-terminal acetylation, which were both specified as variable modifications in the search. (C) Bar plot highlighting previously described artifacts observed in samples prepared using urea buffer (carbamylation) and acetone precipitation (delta mass: +40.03 Da), respectively. y-axis, percentage; x-axis, methods. (D) Similar to (C) except that artifacts derived from reduction (DTT adduct of cysteine) and alkylation (carbamidomethyl) steps are shown. (E) Unknown modifications identified in EasyPep (delta mass: + 26.01 Da) and FASP (delta mass: + 12.00 Da). y-axis, percentage; x-axis, applied methods.
