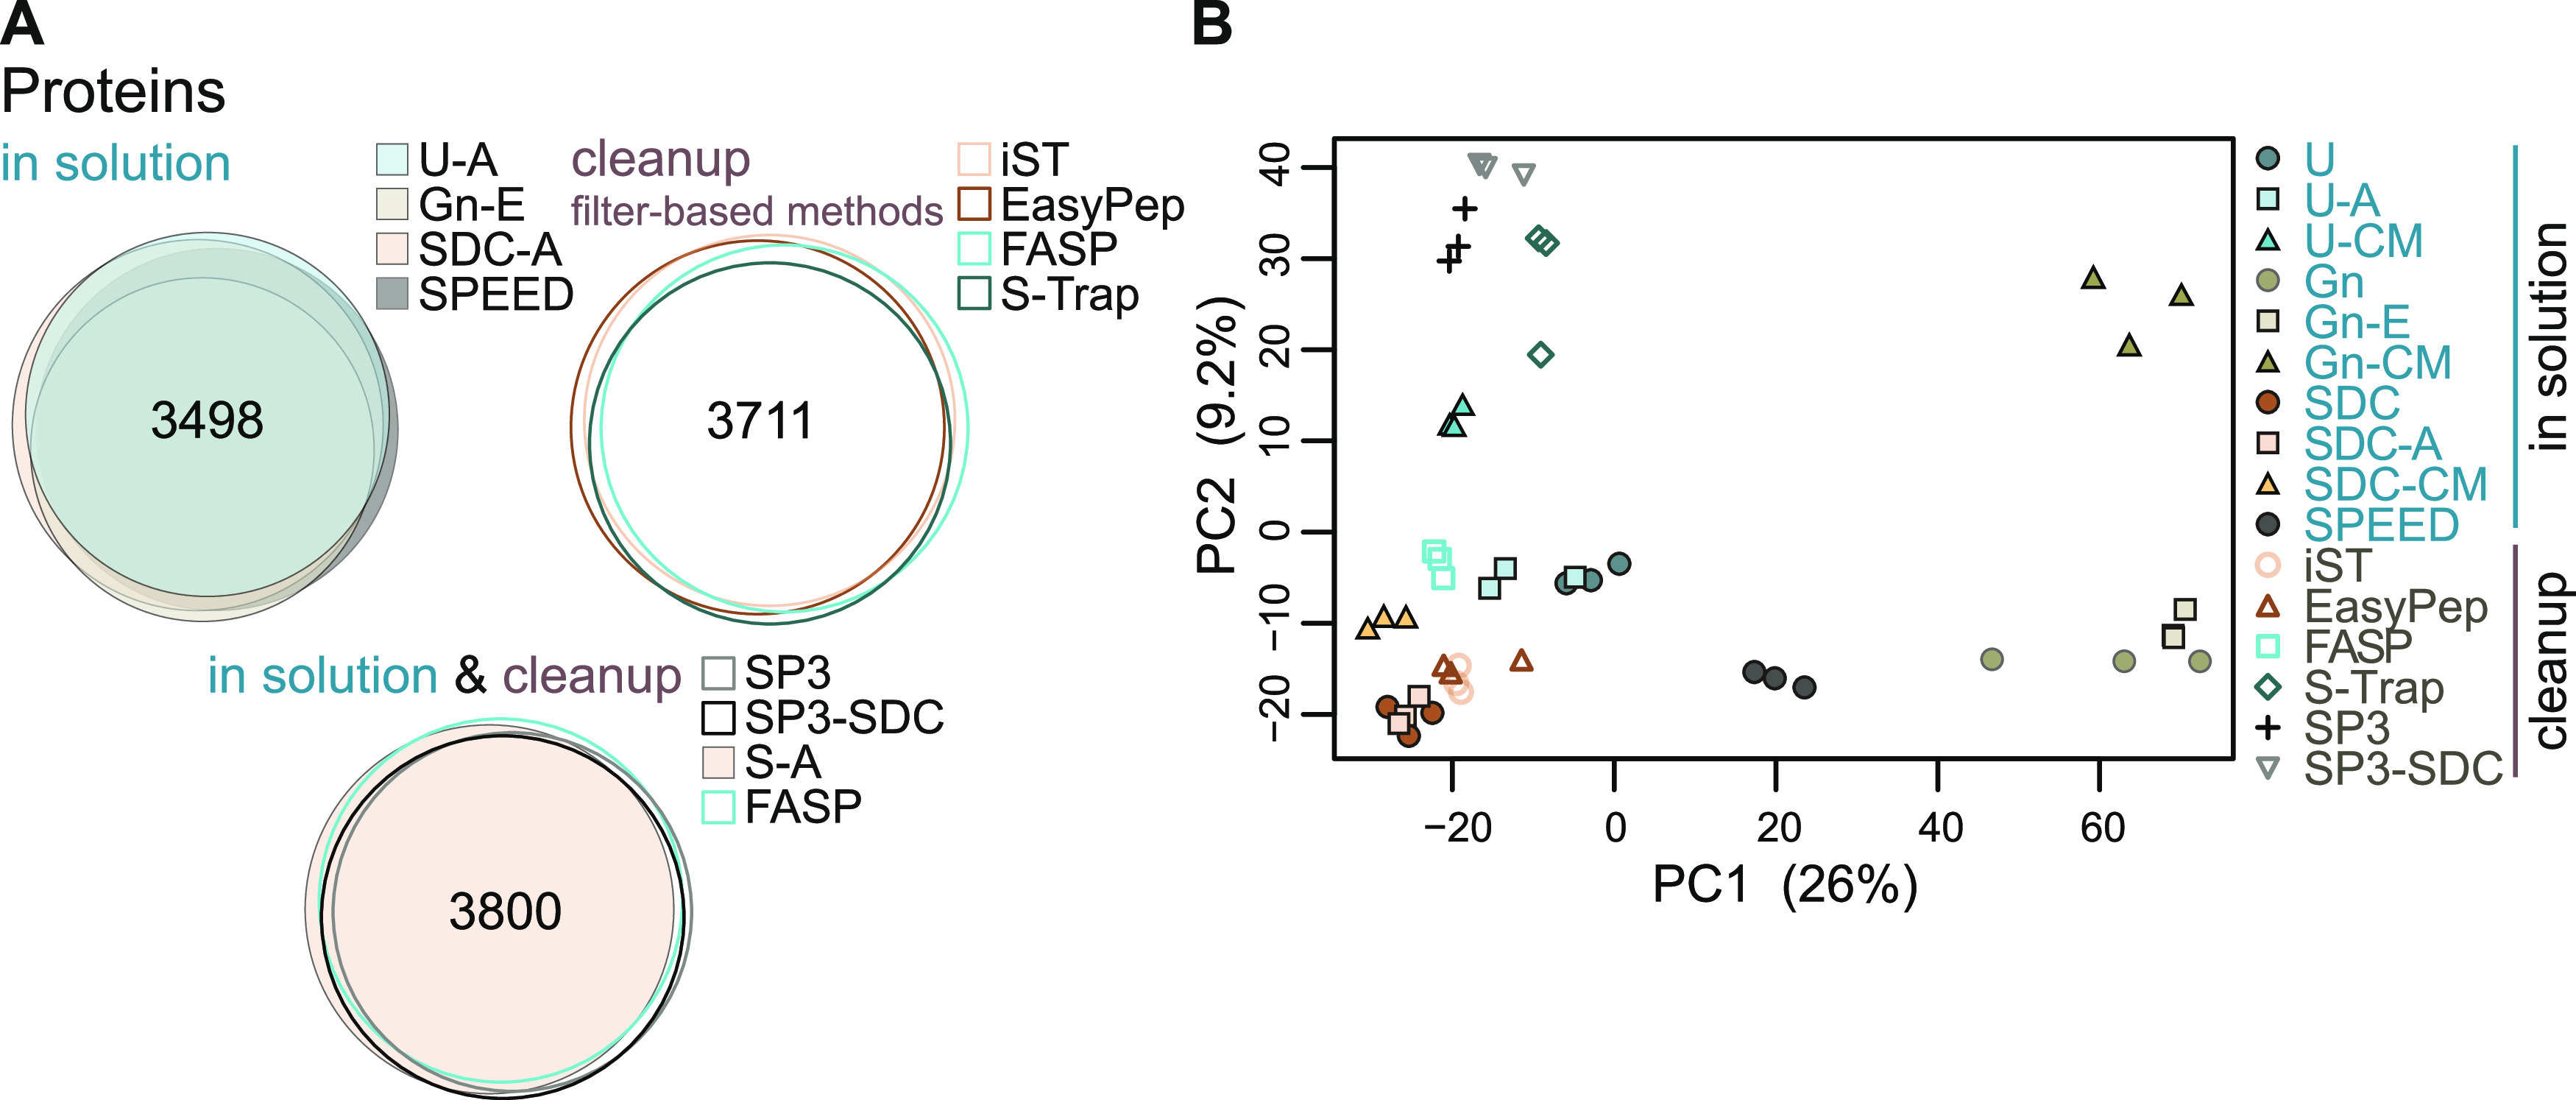
Figure 4.

Overlaps of protein identifications and principal component analysis. (A) Venn diagrams depicting the number of overlapping protein IDs (identified by MS/MS) obtained from different sample preparation methods. (B) Principal component analysis (PCA) based on log2-transformed LFQ intensities after normalization and imputation of missing values.
