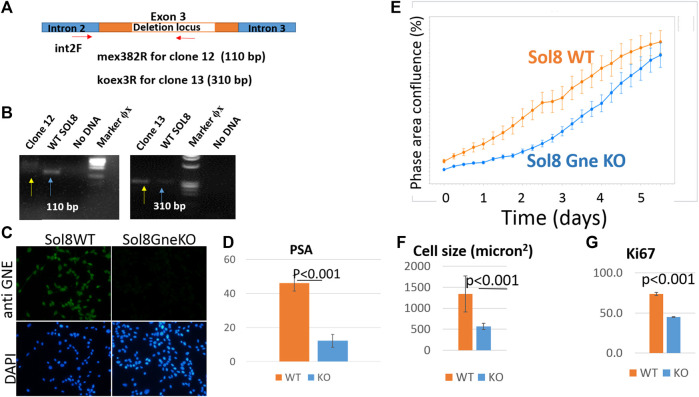
FIGURE 3.
Validation of the GNE KO status in Sol8 manipulated cells. (A), schematic representation of the location of the primers used to verify Gne KO homogeneity; (B), agarose gels illustrating the PCR products of clones 12 and 13 (yellow arrows) compared to controls (blue arrows); (C), immunostaining of Sol8 Gne KO cells with anti-GNE Ab. (D), FACS analysis of PSA positive cells (% of positive cells) (n = 4 replicates); (E), Incucyte confluency analysis; (F), cell size determination (n > 300 cells); (G), FACS analysis of anti Ki67 Ab immunostained Sol8 cells (% of positive cells) (n = 3 replicates).

