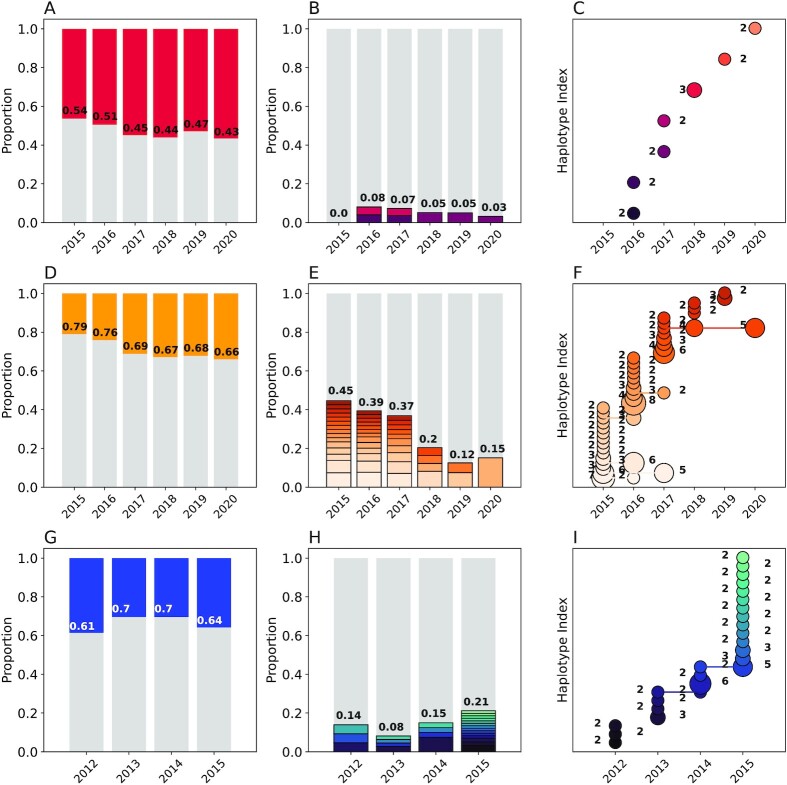
Fig. 3.
Genetic epidemiology of Kédougou (A to C), Thiès (D to F), and Richard Toll (G to I) using the 24 SNP molecular barcode. Column 1 (A, D, andG): the proportion of monogenomic (gray) and polygenomic (colored) samples. The annotated numbers show the proportion of monogenomic samples. Column 2 (B, E, and H): The proportion of clonal haplotypes. The gray bars indicate the unique monogenomic haplotypes and the colors indicate repeated clonal haplotypes within each year, with clonal groups shaded distinctly. The annotated numbers indicate the total proportion of barcodes with at least one clone. Column 3 (C, F, and I): The abundance of clonal haplotypes in each population. Each row represents a unique clonal haplotype, and the number of samples per haplotype is indicated by the size of the circle and the number next to each circle. Connected circles indicate persistent haplotypes observed across multiple years.

