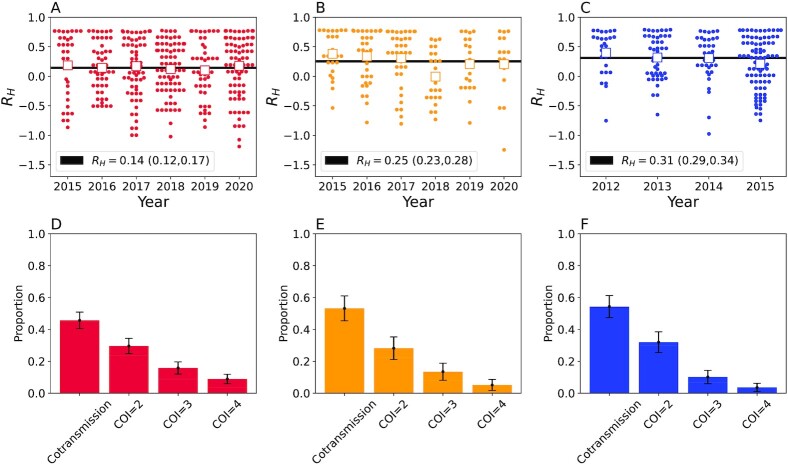
Fig. 5.
Polygenomic infections exhibit reduced heterozygosity. (A to C) The individual RH estimates for each of the clinical polygenomic samples collected from (A) Kédougou (red), (B) Thiès (orange), and (C) Richard Toll (blue). The open-faced square indicates the average RH of the samples in each year and the dark line is the  point estimate obtained for the entire region. The
  point estimate for the entire region and its associated 95% confidence interval are reported in the legend. The proportion of polygenomic infections inferred to be the result of cotransmission or superinfection with COI of two (COI = 2), three (COI = 3), or four strains (COI = 4) in Kédougou (D), Thiès (E), and Richard Toll (F), respectively . The error bars indicate two binomial SDs from the mean for each category.

