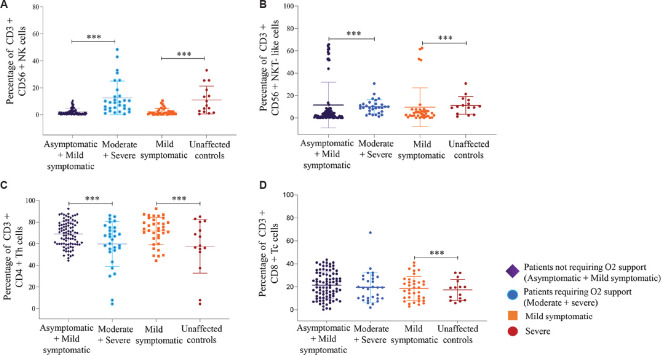
Fig. 3.
Flow cytometric analysis of NK/NKT-like, T cell subsets. PBMCs from 89 patients not requiring O2 support (Asymptomatic+ Mild symptomatic), 30 patients requiring O2 support (Moderate+ Severe), 36 mild symptomatic & 15 severe patients were stained and acquired on flowcytometer. Vertical scatter plots denote the comparisons of frequencies of immune cells and their subpopulation among different study groups: (A) CD3-CD56+ NK cells (B) CD3+CD56+ NKT-like cells (C) CD3+CD4+Th (D) CD3+CD8+Tc cells Data are presented as percentage of immune cells out of lymphocytes. The dots represent individual values and bars represent Mean+SD values. (P ***<0.0001).

