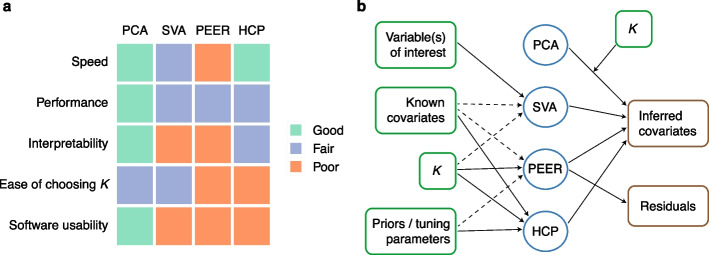
Fig. 1.
Overall comparison of PCA, SVA, PEER, and HCP and summary of their inputs and outputs. In this work, we use K to denote the number of inferred covariates, which are called PCs, SVs, PEER factors, and HCPs in PCA, SVA, PEER, and HCP, respectively. a PCA is faster, better-performing, and much easier to interpret and use. For speed and performance comparison, see Section 2.1 (and to a lesser extent, Sections 2.2 and 2.3). For interpretability and ease of choosing K, see Sections 2.4 and 2.5, respectively. In terms of software usability, SVA is difficult to apply in QTL settings (Additional file 1: Section S4), PEER is difficult to install, and HCP is poorly documented. In addition, PEER suffers from the disadvantage that there is no consensus in the literature on how it should be used (Additional file 1: Section S4). b Inputs (green boxes) and outputs (brown boxes) of the four methods. The fully processed molecular phenotype matrix (after the effects of the known covariates are regressed out in the case of PCA_resid; Table 1) is a required input for all four methods and is thus omitted in the diagram. Dashed arrows indicate optional inputs. PEER outputs both inferred covariates and residuals of the inputted molecular phenotype matrix [32]

