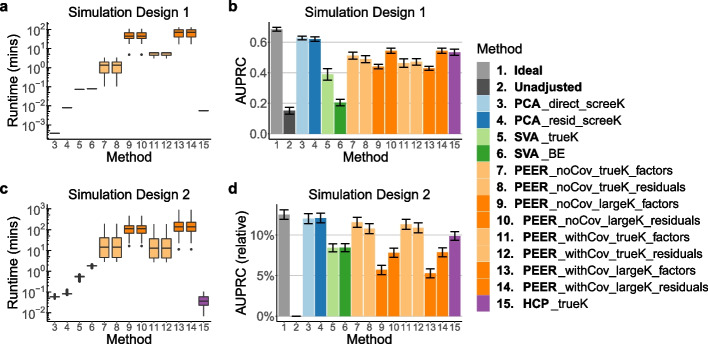
Fig. 2.
Runtime and AUPRC comparison of all 15 methods (Table 1) in Simulation Design 1 and Simulation Design 2. a, c PCA and HCP each takes within a few seconds, SVA takes up to a few minutes, and PEER takes up to about 1000 min, equivalent to about 17 h. In particular, PEER takes longer to run when K is larger (dark orange vs. light orange boxes). b, d PCA outperforms SVA, PEER, and HCP in terms of AUPRC. The height of each bar represents the average across simulated data sets. For ease of visualization, in d, the y-axis displays . In this work, error bars indicate standard errors unless otherwise specified (whiskers in box plots are not considered error bars)

