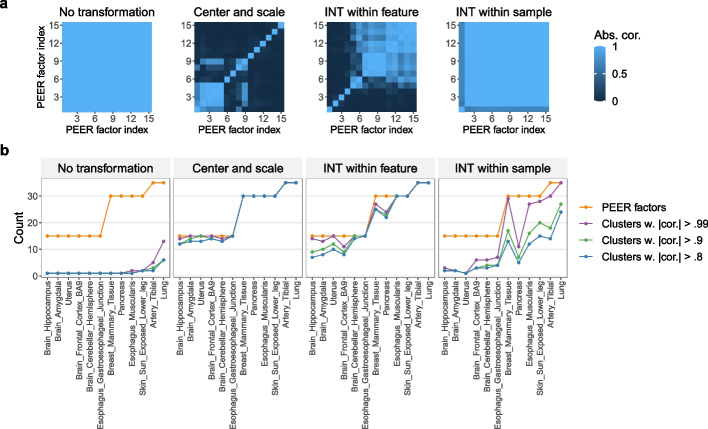
Fig. 4.
In the 3′aQTL data prepared by Li et al. [11] from GTEx RNA-seq reads [9], PEER factors can be highly correlated with each other to the extent that many or all of them are practically identical. a Correlation heatmaps of PEER factors for Brain_Hippocampus. For ease of visualization, the PEER factors are reordered based on results from hierarchical clustering (Section 2.2) in each heatmap. b The x-axis shows 12 randomly selected tissue types with increasing sample sizes. The y-axis shows the number of PEER factors requested (orange line) or the number of PEER factor clusters. Given a set of PEER factors, we group them into clusters such that in each cluster, the correlation between any two PEER factors is above 0.99, 0.9, or 0.8 in absolute value (Section 2.2). Therefore, the number of PEER factor clusters can be interpreted as the number of distinct or nonrepetitive PEER factors. We find that in many cases, the number of distinct PEER factors is considerably smaller than the number of PEER factors requested, and when this issue is severe (e.g., “No transformation” and “INT within sample”), the PEER factors fail to capture important variance components of the molecular phenotype data (Additional file 1: Fig. S5)

