Figure 3.
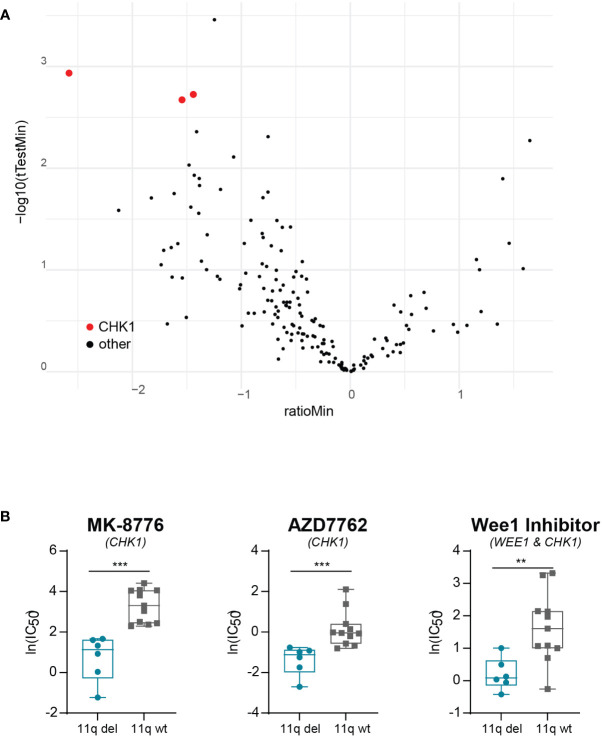
Validation of correlation between 11q loss and CHK1 inhibitor sensitivity. (A) Volcano plot of differential drug sensitivities in 11q deleted versus 11q wild type neuroblastoma cell lines included in the Wellcome Trust Sander Institute dataset. The y-axis shows the inverted p-value (-log10) as derived by student’s t-test and the x-axis shows the effect magnitude (mean IC50 of 11q deleted – mean IC50 of 11q wild type cell lines). Each dot represents one compound and those targeting CHK1 are highlighted in red. (B) Box plot of IC50 values of NB cell lines included in the Wellcome Trust Sanger Institute dataset after exposure to CHK1 inhibition with MK-8776 (p = 0.0002), AZD7762 (p = 0.0003) or Wee1 Inhibitor (p = 0.0071). Statistical significance is reached (Mann-Whitney U test).

