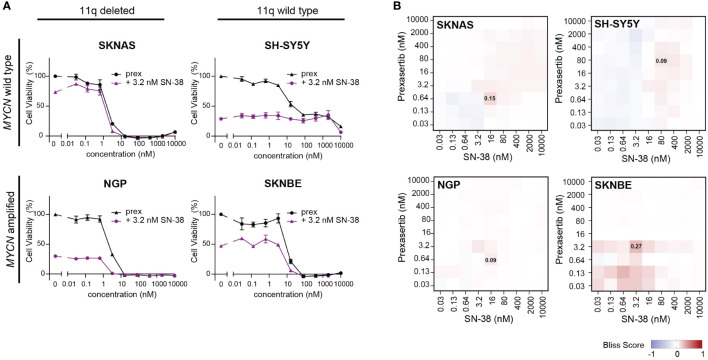
Figure 6.
CHK1 inhibition combined with SN-38 treatment demonstrates additive effects. (A) Dose-response curves for classical for 11q deleted/wild type cell lines with and without MNA following 72-hour exposure to prexasertib alone (prex, black) or in combination with 3.2 nM of SN-38 (purple). All curves represent the average of replicates (n=2) where error bars indicate the standard error of the mean (SEM). (B) Heatmaps indicating the calculated bliss independence scores for cell lines treated with 0.03-10 µM prexasertib and SN-38.

