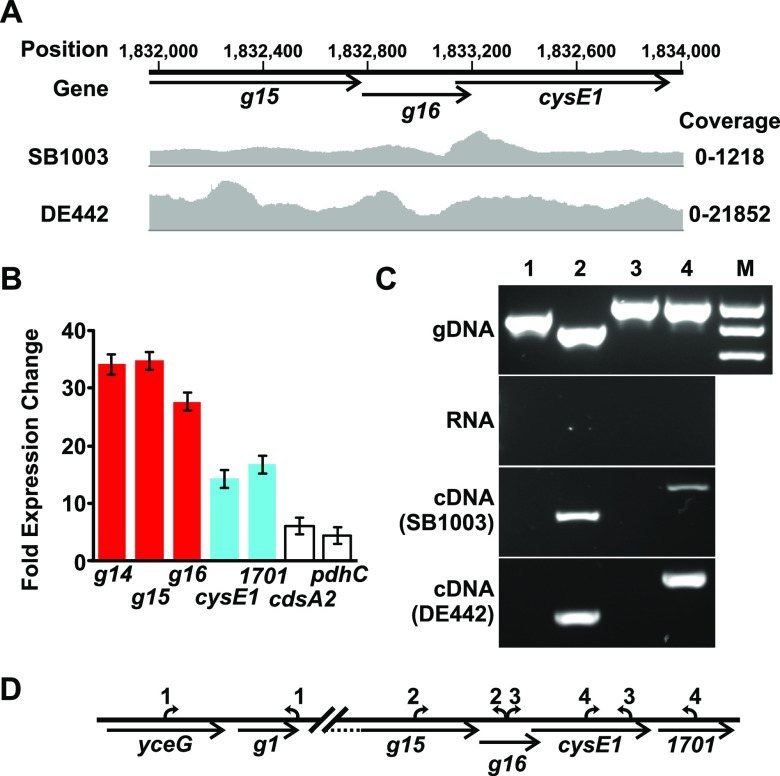
FIG 1.
Defining the RcGTA transcriptional unit. (A) Representative histograms showing RNA-seq transcript coverage from the R. capsulatus wild-type strain SB1003 and the GTA overproducer DE442. Genome position (in base pairs) is indicated at the top, and the location of each gene is depicted with arrows beneath. The RNA-seq data set was described in reference 23, and the raw data can be found in the NCBI GEO Database, accession no. GSE118116. (B) Chart showing fold changes in gene expression between R. capsulatus DE442 (n = 8) and wild-type SB1003 (n = 4) in the GSE118116 data set. Red bars indicate constituents of the core RcGTA gene cluster, cyan shows the cysE1 transcriptional unit, and white indicates the genes immediately downstream. Error bars represent standard deviations. (C) Agarose gel of a representative RT-PCR amplification. Templates were genomic DNA, DNA-free RNA, and cDNA isolated from SB1003 and DE442, as indicated. The 600- to 1,000-bp portion of the HyperLadder 1-kb DNA marker is included for reference (M) (Meridian Bioscience, Cincinnati, OH). PCR amplification occurred across the gene junctions indicated above each well and defined in panel D. (D) Schematic of the regions immediately before and after the RcGTA gene cluster. Primer pairs are numbered 1 to 4 and correspond to the wells shown in the preceding gel. The yceG gene immediately precedes the RcGTA small terminase gene, g1, which has previously been confirmed as the first gene of the operon and was used here as a negative control for genomic DNA carryover.

