Fig. 5.

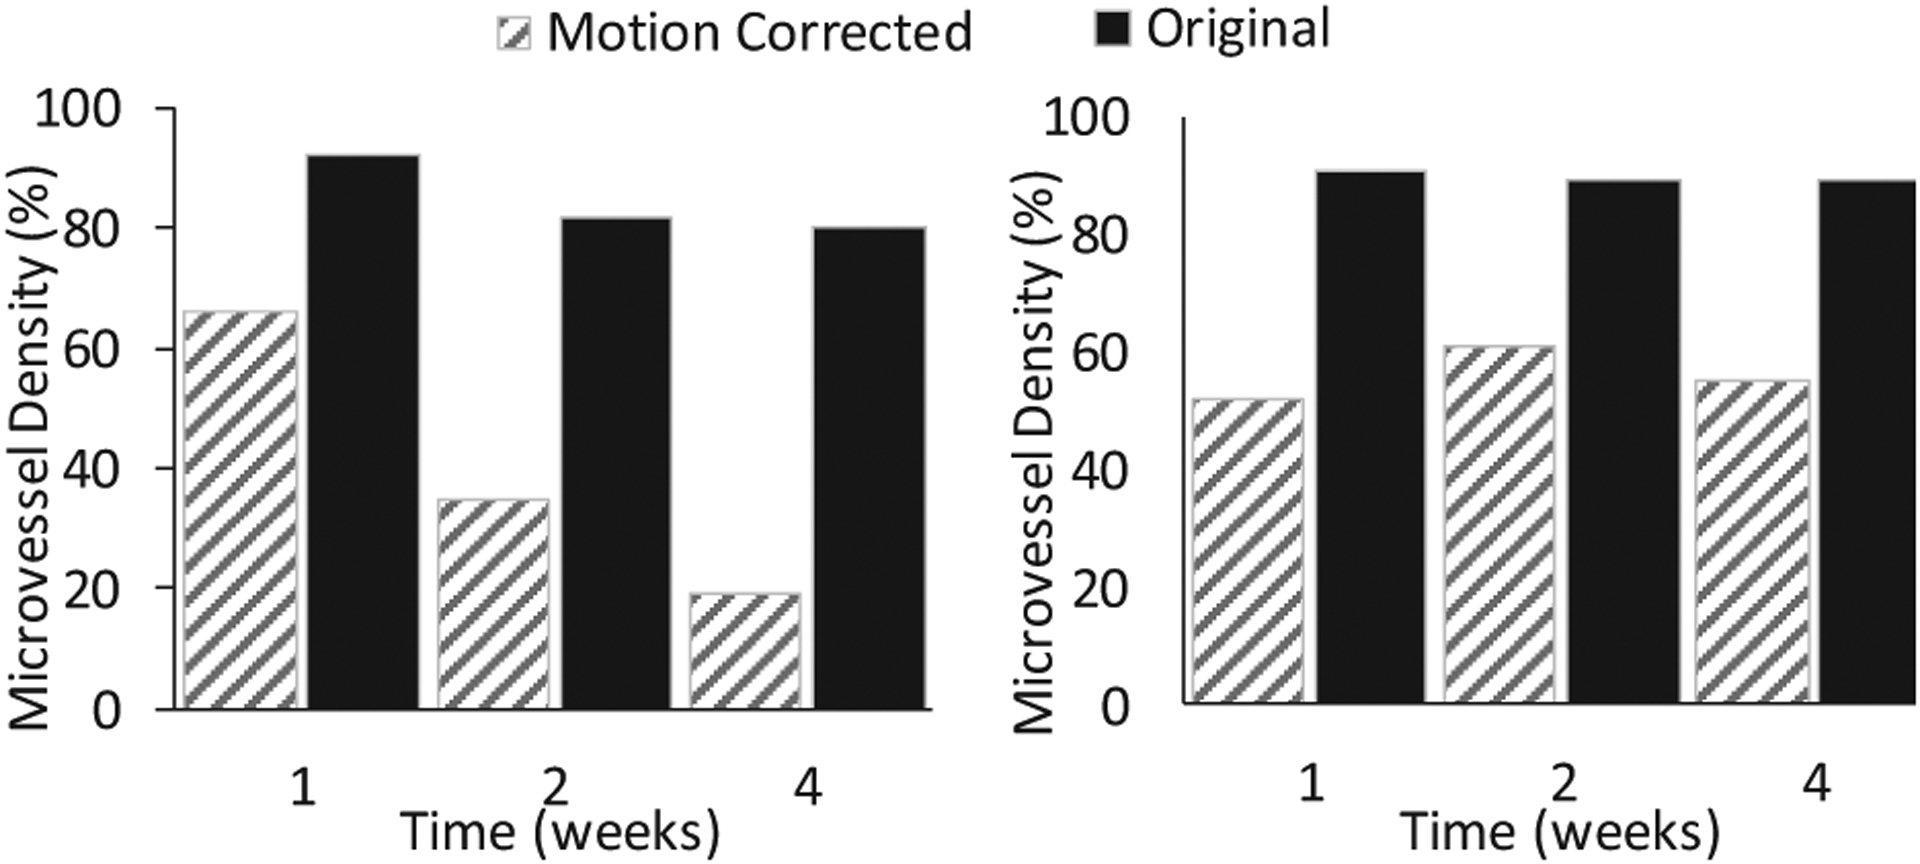
Higher relative changes in MVD values for complete response subject when motion was corrected (left). Consistent MVD values indicating the incomplete response to the therapy (right).

Higher relative changes in MVD values for complete response subject when motion was corrected (left). Consistent MVD values indicating the incomplete response to the therapy (right).