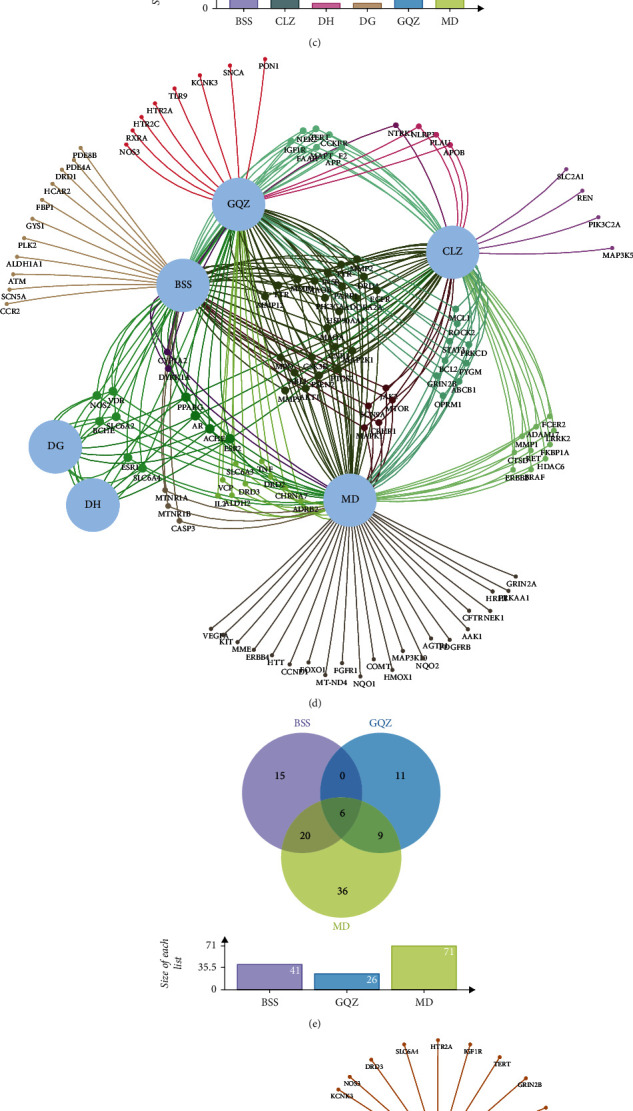
Figure 2.

Interactive Venn diagrams. (a) Potential targets of YGJ against PD. (b) Potential targets of YGJ-BBB against PD. (c) Intersections of potential targets of YGJ. (d) Visualization interactive network of potential targets of YGJ. (e) Intersections of potential targets of YGJ-BBB. (f) Visualization interactive network of potential targets of YGJ-BBB.
