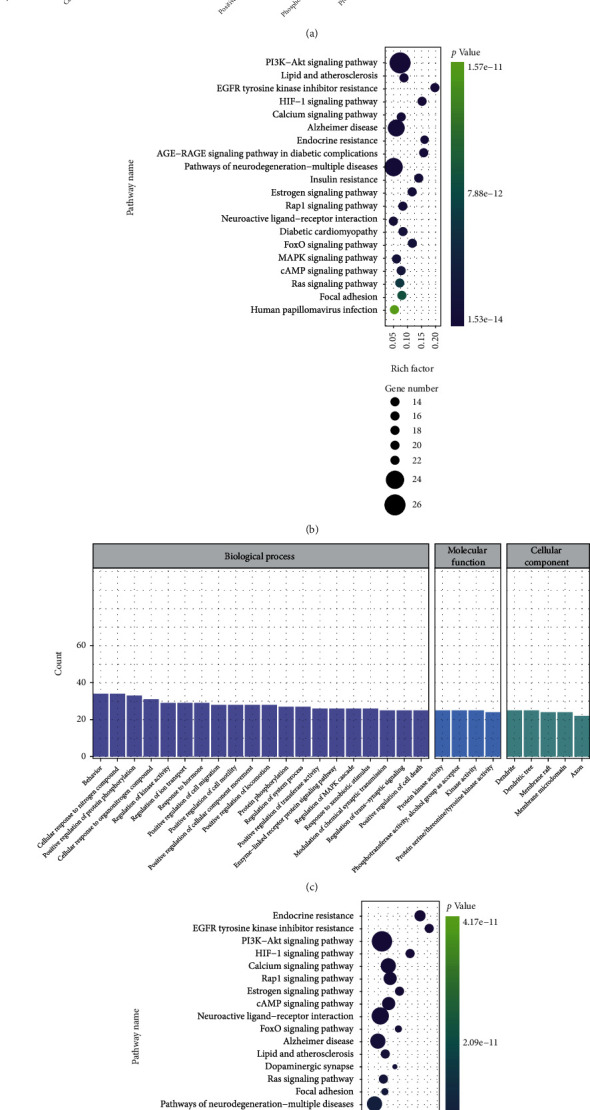
Figure 5.

GO functional and KEGG pathway enrichment analyses. (a) GO functional enrichment analyses of YGJ against PD, count over 20. (b) KEGG pathway enrichment analyses of YGJ against PD, sort by P value. (c) GO functional enrichment analyses of YGJ-BBB against PD, count over 20. (d) KEGG pathway enrichment analyses of YGJ-BBB against PD, sort by P value.
