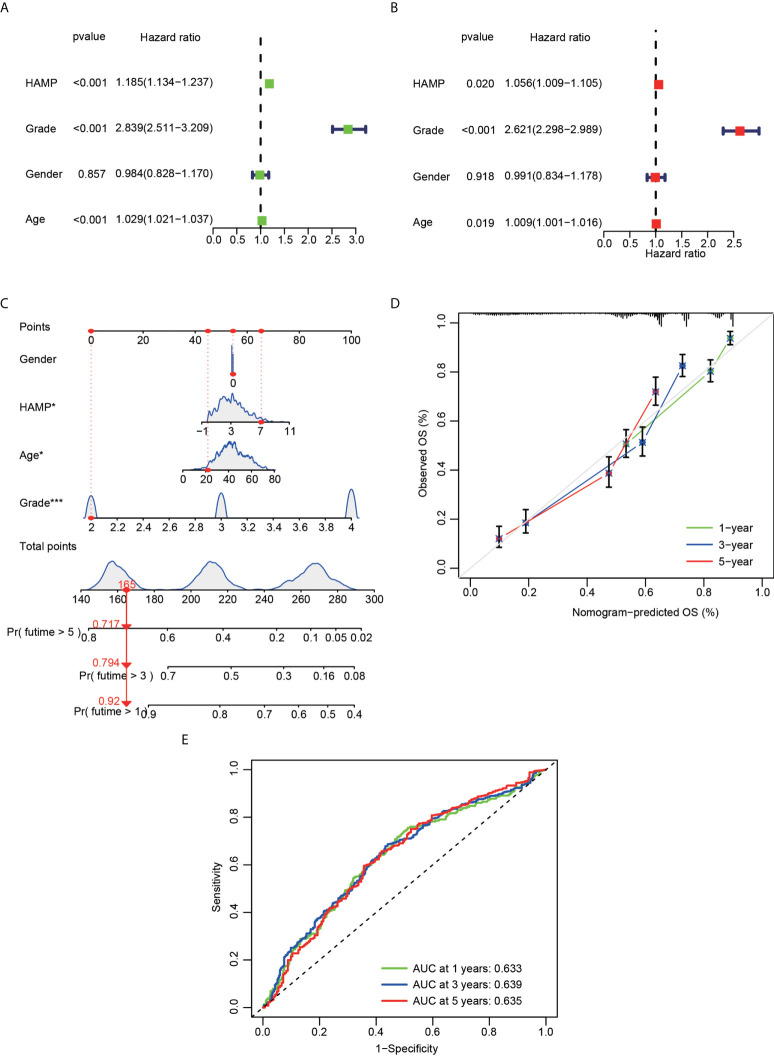
Figure 4.
Cox regression analysis and establishment of a prognostic model using the CGGA dataset. (A) Univariate analysis of hepcidin expression in the CGGA dataset. (B) Multivariate analysis of hepcidin expression in the CGGA dataset. (C) The nomogram was constructed based on four factors for predicting 1-year, 3-year or 5-year survival of patients with glioma in the CGGA database. (D) The calibration plots of internal validation in CGGA dataset showed good consistency in predicting 1-year, 3-year or 5-year survival. (E) The 1-year, 3-year and 5-year ROC curves for the CGGA dataset. *p < 0.05 and ***p < 0.001.

