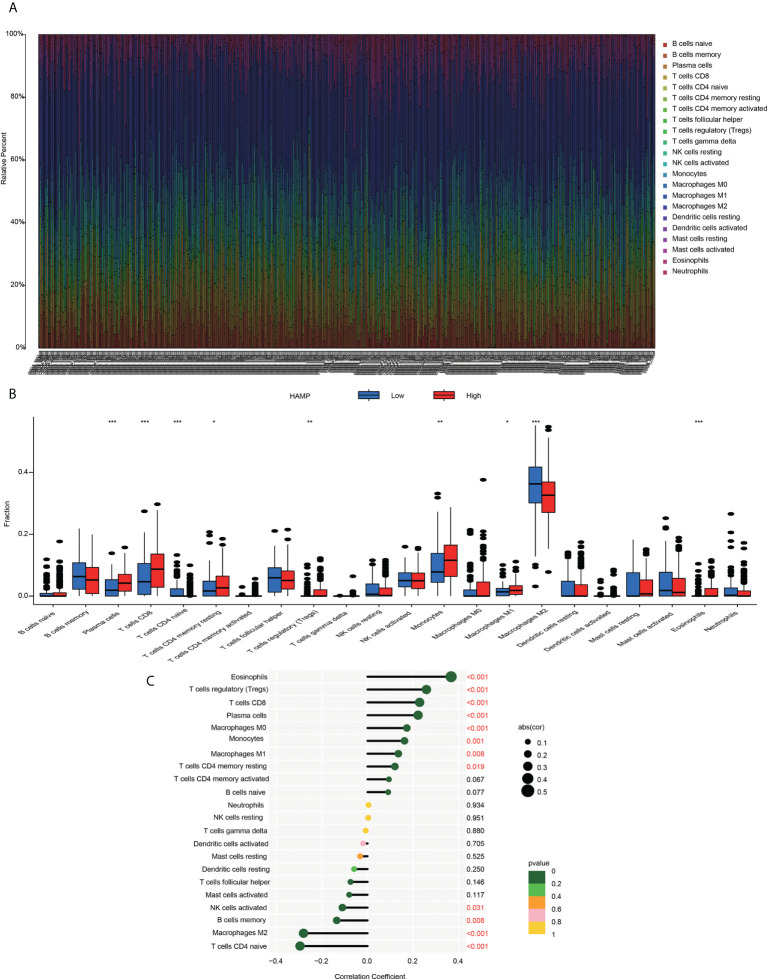
Figure 7.
Immune cell infiltration with the CIBERSORT algorithm (A) The abundance ratios of immune cells in the CGGA samples. The 22 specific immune cells corresponding to one sample by different colors, as shown in the bar plot. (B) The varied proportions of 22 subtypes of immune cells in the high and low hepcidin groups in tumor samples. Horizontal and vertical axes represent TIICs and relative percentages, respectively. Blue and red colors represent the low and high hepcidin expression groups, respectively. (C) The correlation between immune infiltrating cells and hepcidin expression. The ordinate represents the name of the immune cell, and the abscissa represents the correlation coefficient. *p < 0.05, **p < 0.01, and ***p < 0.001.

