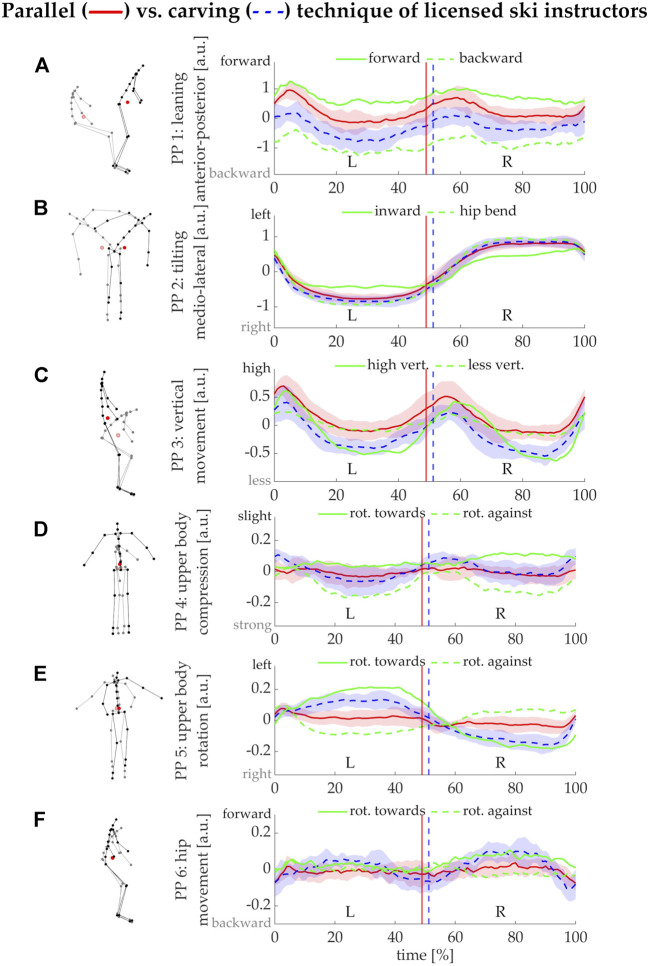
FIGURE 4.
Left: stick figure representation of the first six principal movements (PMs). Right: time series representation for each principal movement position PPk(t) [k = 1.6] (A–F) interpolated to 100% of a left(L)-right(R) ski turn cycle. For each PM, the instruction trials that caused the largest differences in the PP(t)—e.g., for PM1 the instructions to lean forward or backward—are displayed as continuous and broken green lines (means over all turn cycles of all volunteers). The red and blue lines and shaded areas represent the mean and standard deviations obtained from the parallel and carving turns of all the volunteers, respectively. Vertical lines indicate the mean time point of transition from L to R turn.

