. 2022 Sep 2;4(20):4391–4401. doi: 10.1039/d2na00409g

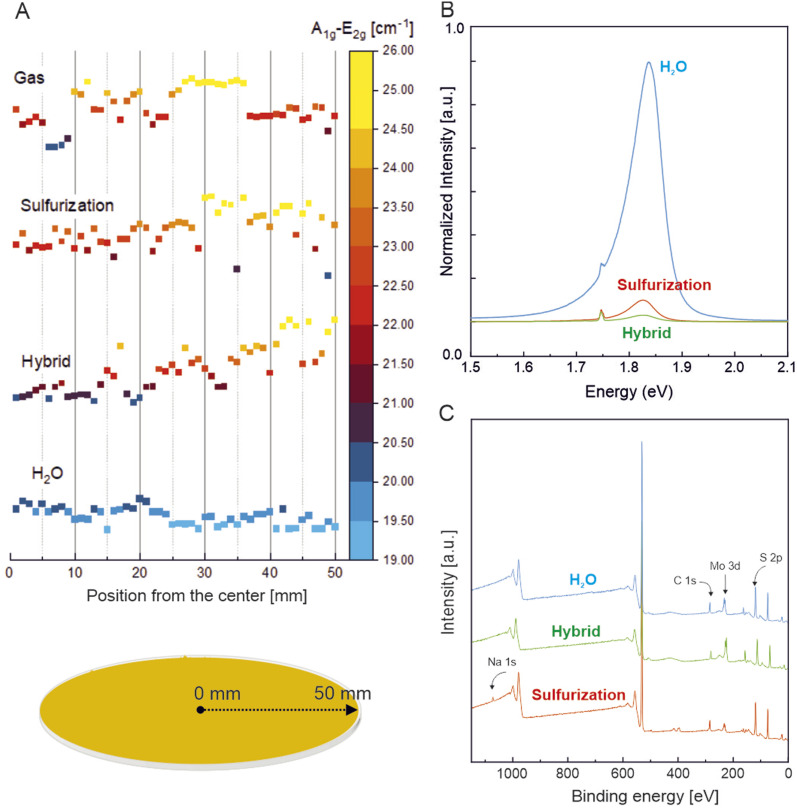
Fig. 4. An average separation of E2g and A1g Raman peaks taken from 50 measurements with a 1 mm interval performed across the radial direction of the wafer (A). Measurements were performed in a line-scan fashion, from the center to the edge of the 4-inch substrate. Comparison of characteristic Raman peak separation shows the radial uniformity of MoS2 synthesised with the water-vapor assisted growth method. Representative PL spectra (B) showing significantly higher PL emission from water assisted growth. A comparison of wide XPS spectra (C) shows no residual Na present with H2O assisted growth. Detailed analysis of Mo 3d and S 2p XPS peaks is shown in ESI Fig. S5..

Fig. 4