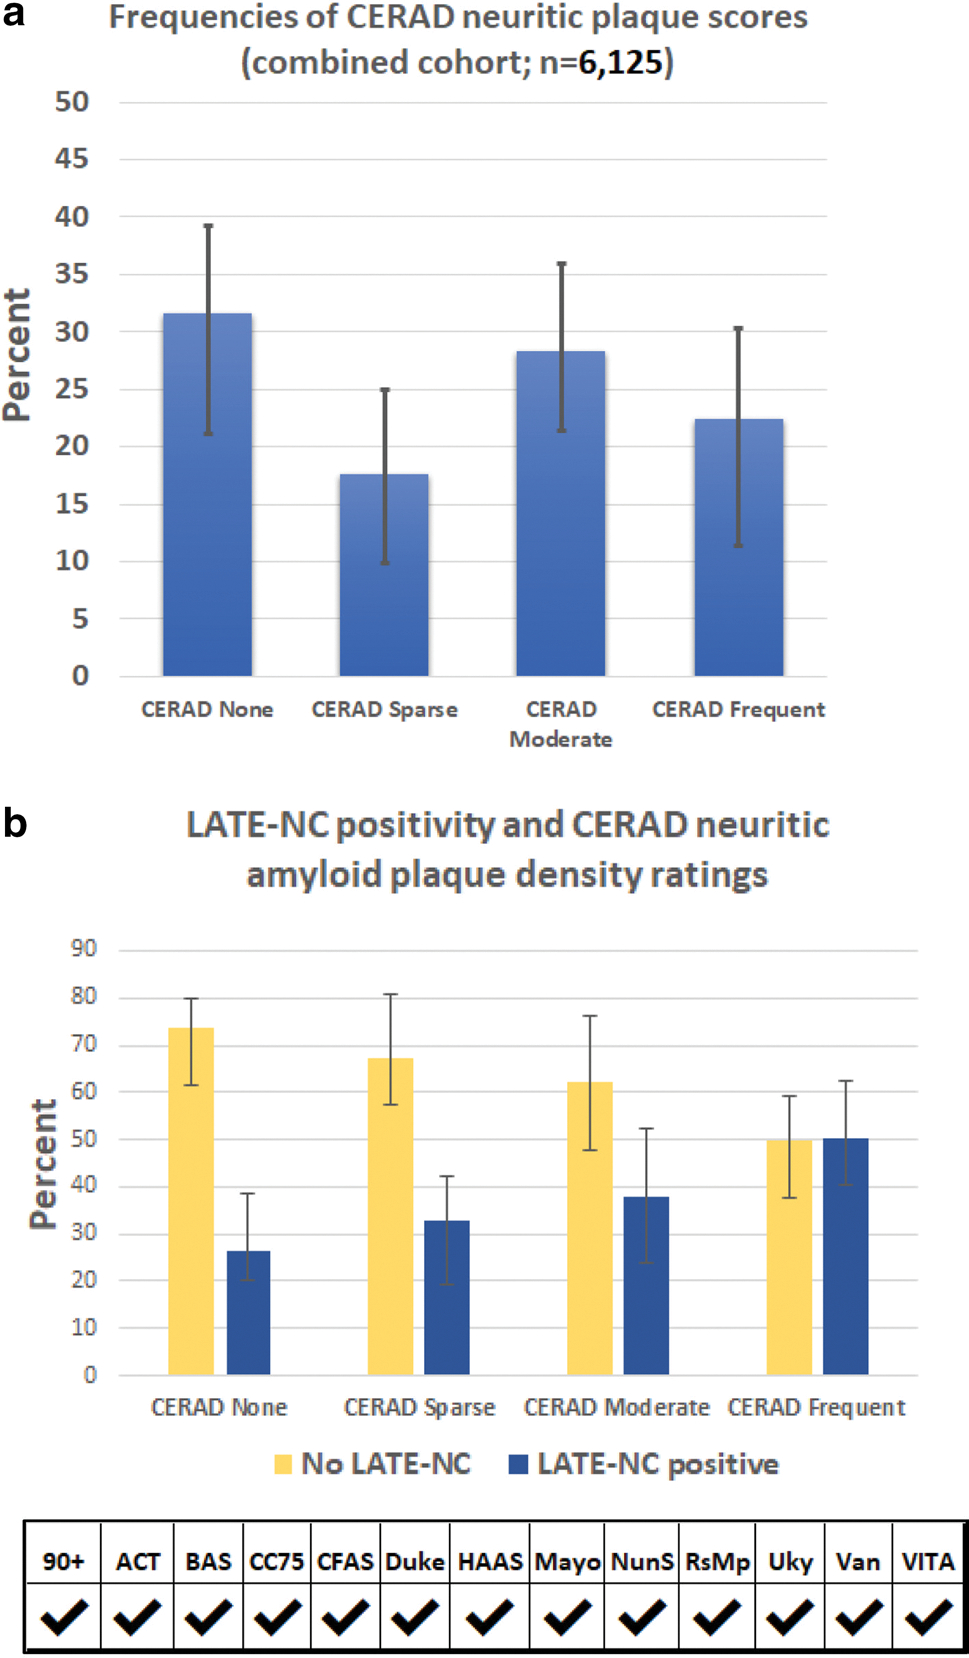
Fig. 3.

LATE-NC absence or presence, stratified by CERAD neuritic amyloid plaques scores. All LATE-NC stages were combined and the results from each of the cohorts averaged. The frequency of LATE-NC increased with greater neuritic amyloid plaque densities. The distribution of CERAD plaques by frequencies is shown in (a). Note that subgroups with none or minimal ADNC were the most well represented in this combined meta-cohort (see Table 2). Correlation with LATE-NC status is shown in (b). Given the study design differences between cohorts, the results were generally consistent. For these charts, the results of each cohort were weighted equally in order to convey the cohort-to-cohort variance. For exact numbers of participants included from each cohort, see Supplemental Table 3, online resource. Error bars denote 25th and 75th percentiles
